Agrivoltaics Market 2025–2032: Advancing Climate-Resilient Farming and Solar Deployment
The Agrivoltaics Market Size (2025–2032) is expected to grow from USD 5.78 billion in 2025 to USD 23.1 billion by 2032, registering a CAGR of 21.89%, driven by accelerating renewable energy targets, rising land-use efficiency requirements, supportive government policies, increasing farmer income diversification needs, and technological advancements in solar module efficiency and smart farming integration.
Agrivoltaics Market Report Overviews
The Global Agrivoltaics Market Growth Analysis highlights a structural transformation driven by the accelerating energy transition, land-use optimization strategies, and technological innovation in solar-agriculture integration. The market will expand from USD 5.78 billion in 2025 to USD 23.1 billion by 2032 due to three main factors: increasing renewable energy capacity additions, government incentives that support dual land use, rising food–energy security concerns, and the deployment of advanced photovoltaic systems that use precision agriculture technologies.
Agrivoltaics Market Key Highlights
- The global agrivoltaics market is expected to reach 36,317.4 MW by 2027, registering a high CAGR of 45% (2021–2027), with total installed capacity expected to exceed 10 GW+ by 2030, reflecting accelerating global adoption.
- The total worldwide solar power capacity reached 14 gigawatts.
- India can generate 630 gigawatts of power from 1% of its agricultural land, which produces 450 kilowatts peak per hectare.
- The energy requirements are expected to rise 50 % between the years 2019 and 2030.
- Agricultural land makes up 60.4% of India’s total surface area.
- Total solar PV investments are forecasted to reach USD 2 billion through 2030, with balanced allocation between utility-scale and distributed (commercial, industrial, residential) segments.
- Floating solar technology shows great potential as it fulfilled approximately 1 % of global solar requirements during 2021. The market, which had an estimated capacity of 1.6 thousand MW in 2021, will experience growth to 4.8 thousand MW by 2026. The next five years will see China emerge as the leading nation for floating solar installations while India and South Korea will follow behind.
Title: Agrivoltaics Market Growth: Powering the Future of Food and Energy.
To get more Insights: Request Free Sample Report
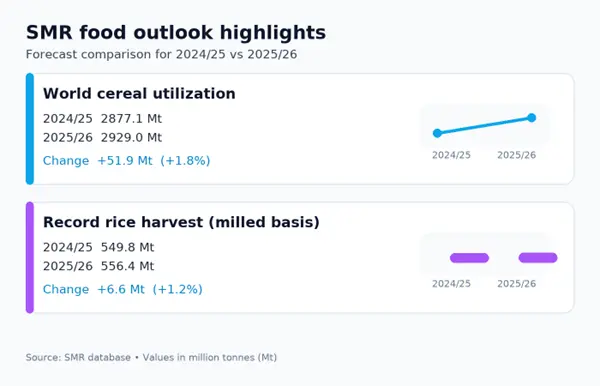
The upward trend in global cereal utilization and record rice harvest, as reflected in the image, indicates rising agricultural production demand and sustained pressure on arable land. This creates a strong opportunity for the Agrivoltaics Market, as farmers increasingly seek solutions that allow simultaneous crop cultivation and renewable energy generation. The dual land-use model enhances land productivity, supports climate resilience, and provides additional income streams. Growing food demand combined with clean energy transition goals positions agrivoltaics as a strategic long-term opportunity.
Agrivoltaics Market Converts Regulation into Structural Growth
The Agrivoltaics Market actively benefits from policy frameworks that restrict conventional ground-mounted solar on productive farmland while permitting elevated dual-use systems. Italian regulations require solar panels to maintain a minimum height of 2.1 meters, which allows farmers to continue their agricultural activities under solar panel installations. U.S. regions like California accelerate approvals for integrated farm-solar systems. The regulatory framework directs renewable energy investments toward agrivoltaics while decreasing utility-scale price competition risks and supporting energy growth that matches national food security needs.
Agrivoltaics Market Enhances Crop Productivity While Generating Energy.
The Agrivoltaics Market strengthens its value proposition by improving on-field productivity. Field studies demonstrate that solar arrays produce more than 10 % greater yield because they reduce temperature stress and maintain soil moisture. China’s dry-hot valleys show that soil microbes increased their activity while crops gained more ability to withstand drought conditions. Dynamic solar structures in France provide better frost protection for farms than traditional farming methods. Farmers also report water-use reductions of up to 50% in vegetable cultivation, which proves that agrivoltaics functions as a dual solution for both energy generation and agricultural productivity.
Agrivoltaics Farms in the United States
|
Project / Location |
Capacity |
Key Stakeholders |
Agrivoltaics Model |
Strategic Highlights |
|
Jack’s Solar Garden, Boulder County, Colorado (USA) |
1.2 MW |
Local subscribers, City of Boulder, Boulder County |
Multi-crop cultivation + pollinator habitat integration |
Largest agrivoltaics research site in the U.S.; powers ~300 homes; 40+ crop varieties under arrays; 3,000 pollinator-friendly plants integrated |
|
Solinator Garden, Fort Collins, Colorado (USA) |
1 MW |
City of Fort Collins, Namasté Solar, Solaris Energy |
Pollinator-friendly solar + elevated tracker systems |
2,700 panels integrated with biodiversity-focused vegetation; mixed panel heights (6 ft & 8 ft); powers ~250 homes annually |
|
Crescent Run Farm, Skowhegan, Maine (USA) |
4 MW |
ReVision Energy, Municipal entities |
Sheep grazing (solar grazing model) |
10,500 panels; supplies power to multiple municipal buildings and a public school; livestock-based vegetation management |
Adoption in 2025 will follow BOS cost tiers: low-cost systems expand fast, high-cost crop-integrated systems need focused investment.
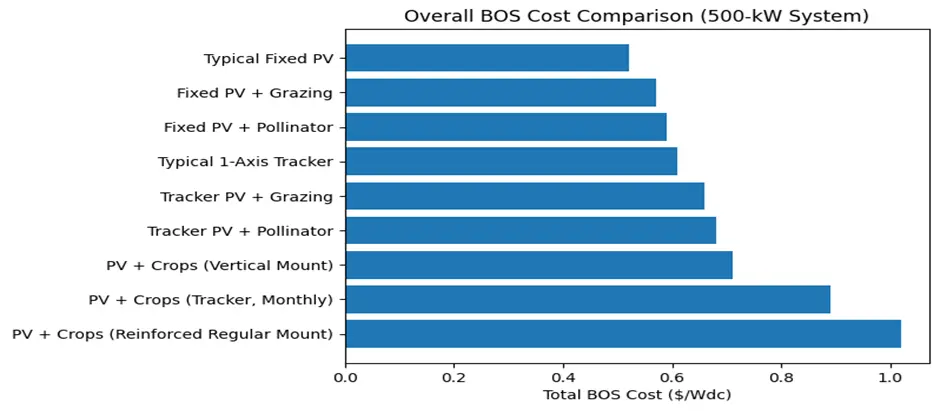
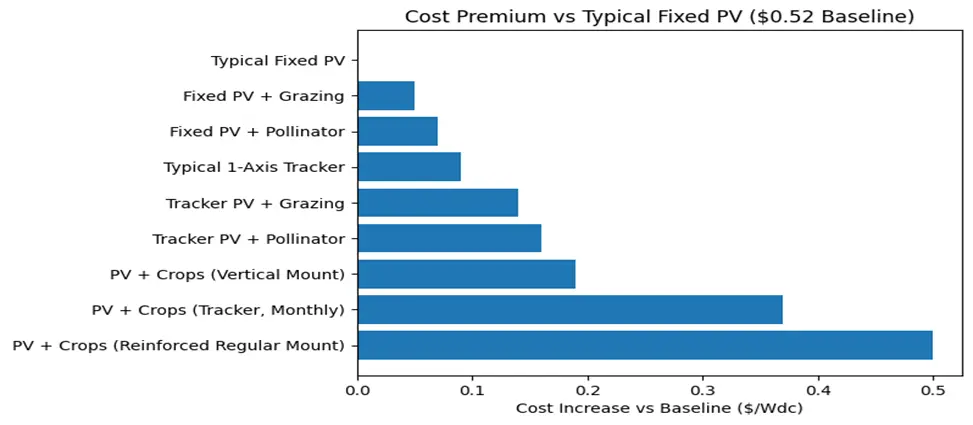
Balance of System (BOS) costs create clear adoption tiers for agrivoltaics. Low-cost ecological integrations, such as grazing and pollinator habitats, increase BOS by only 10–15%, enabling rapid deployment and ESG-focused projects. In contrast, crop-integrated systems with trackers or reinforced structures raise costs by 35–95%, requiring careful investment and policy support. Consequently, the pace and pattern of agrivoltaics adoption in 2025 will follow these structured BOS cost tiers.
Agrivoltaics Market Segment Analysis
|
Segmentation Type |
Segments |
|
By System Design |
Dynamic Panel Fixed Panel |
|
By Technology |
Monofacial Bifacial Translucent |
|
By Crop |
Fruits Vegetables Others |
|
By Placement |
Greenhouses Ground Mounted Shading Nets |
|
By Application |
Grassland Farming Horticulture and Arable Farming Indoor Farming |
Agrivoltaics Consumer Preferences
Based on system and market surveys, adoption preferences among agrivoltaics stakeholders can be grouped as follows:
- Early adopters / ESG-focused farmers (low-cost, ecological integrations): 70–75%
- Most likely to implement grazing or pollinator-friendly systems due to lower costs and simpler deployment.
- Conventional farmers / traditional agricultural operators (moderate-cost, crop-integrated systems): 12–15%
- Require higher incentives or policy support to invest in tracker or reinforced systems.
- Other methods / experimental approaches: 10–16%
- Small segment exploring hybrid or innovative configurations.

Agrivoltaics Market Regional Analysis
The degree of agrivoltaics implementation differs from one region to another. China maintains its global leadership by possessing the most extensive agrivoltaics system, which includes the Ningxia project that spans 20 million square meters of desert land. The combination of strong government support and large-scale solar farm connections has resulted in swift system implementation. Europe demonstrates close development to China through its countries, including France, Germany, and Italy, which fund demonstration projects and research initiatives that study agrivoltaics applications for fruit and vegetable and livestock production.
The region experiences adoption growth because of its policy incentives and sustainability targets. The United States presently lags in adoption because its activities remain confined to demonstration and pilot testing sites. Commercial deployment has faced delays from high upfront costs, regulatory obstacles, and insufficient policy support, yet there remains potential for pollinator-friendly and crop-integrated systems. China dominates the sector through its large-scale operations, while Europe excels at developing new technologies through its policy-based adoption practices, and the United States market remains at the beginning stages of product commercialization.
Agrivoltaics Market Key Players
- Sun’Agri
- Enel Green Power
- BayWa r.e. AG
- Fraunhofer ISE
- Next2Sun Technology GmbH
- Insolight SA
- REM TEC s.r.l.
- Kyocera Corporation
- Acciona Energía
- EDF Renewables
- Zimmermann PV-Stahlbau GmbH
- Scatec ASA
- Arava Power Company
- Ameresco
- ENGIE SA
- R.Power Group
- TNO
- Hevel Solar
- TotalEnergies SE
- Trina Solar
- JinkoSolar
- Canadian Solar
- First Solar
- LONGi Green Energy Technology
- Iberdrola, S.A.
- RWE Renewables
- Lightsource bp
- Ombrea
- SunPower Corporation
- Namaste Solar
Frequently Asked Questions
1. Agrivoltaics Market: Executive Summary
1.1. Market Size (2025) & Forecast (2025–2032)
1.2. Market Size (Value in USD Million) and Market Share (%) – By Segments, Region, Country
2. Agrivoltaics Market: Competitive Landscape
2.1. MMR Competition Matrix
2.2. Key Players Benchmarking
2.2.1. Company Name
2.2.2. Headquarters
2.2.3. System Design Segment / System Type
2.2.4. Technological Integration (AI, Racking, Polymers)
2.2.5. Total Company Revenue (2025)
2.2.6. Global Presence
2.3. Top Key Players Market Share (%)
2.4. Market Structure
2.4.1. Leaders
2.4.2. Followers
2.4.3. Emerging Players
2.5. Mergers, Acquisitions & Partnerships
2.6. Recent Developments
2.7. Kano Model Competitive Analysis
3. Agrivoltaics Market: Dynamics
3.1. Market Trends
3.2. Market Dynamics
3.2.1. Drivers
3.2.2. Restraints
3.2.3. Opportunities
3.2.4. Challenges
3.3. Porter’s Five Forces Analysis
3.4. PESTEL Analysis
3.5. Key Opinion Leader Analysis
4. Consumer Preferences and Adoption Trends
4.1. Early Adopters / ESG-focused Farmers
4.2. Conventional Farmers / Traditional Operators
4.3. Experimental & Hybrid Approaches
4.4. Regional Demographics and Adoption Patterns
5. Pricing Analysis
5.1. Cost of Agrivoltaics Systems (2025)
5.2. Comparative Pricing by System Type
5.3. Regional Price Variations
6. Regulatory and Environmental Framework – By Region
6.1. North America
6.2. Europe
6.3. Asia-Pacific
6.4. Middle East & Africa
6.5. South America
7. Technological Innovations & System Development
7.1. AI Integration in Agrivoltaics Management
7.2. Transparent Polymers & Materials
7.3. Advanced Mounting Structures & Racking Systems
7.4. Synergies with Livestock, Crops, and Pollinators
8. Global Agrivoltaics Market Size and Forecast by Segmentation (by Value USD Million) (2025-2032)
8.1. Agrivoltaics Market Size and Forecast, By System Design
8.1.1. Dynamic Panel
8.1.2. Fixed Panel
8.2. Agrivoltaics Market Size and Forecast, By Technology
8.2.1. Monofacial
8.2.2. Bifacial
8.2.3. Translucent
8.3. Agrivoltaics Market Size and Forecast, By Crop
8.3.1. Fruits
8.3.2. Vegetables
8.3.3. Others
8.4. Agrivoltaics Market Size and Forecast, By Placement
8.4.1. Greenhouses
8.4.2. Ground Mounted
8.4.3. Shading Nets
8.5. Agrivoltaics Market Size and Forecast, By Application
8.5.1. Grassland Farming
8.5.2. Horticulture and Arable Farming
8.5.3. Indoor Farming
8.6. Agrivoltaics Market Size and Forecast, By Region
8.6.1. North America
8.6.2. Europe
8.6.3. Asia Pacific
8.6.4. Middle East and Africa
8.6.5. South America
9. North America Agrivoltaics Market Size and Forecast by Segmentation (by Value in USD Million) (2025 -2032)
9.1. North America Market Size and Forecast, By System Design
9.2. North America Market Size and Forecast, By Technology
9.3. North America Agrivoltaics Market Size and Forecast, By Crop
9.4. North America Agrivoltaics Market Size and Forecast, By Placement
9.5. North America Agrivoltaics Market Size and Forecast, By Application
9.6. North America Market Size and Forecast, By Country
9.6.1. United States
9.6.2. United States Market Size and Forecast, By System Design
9.6.3. United States Market Size and Forecast, By Technology
9.6.4. United States Agrivoltaics Market Size and Forecast, By Crop
9.6.5. United States Agrivoltaics Market Size and Forecast, By Placement
9.6.6. United States Agrivoltaics Market Size and Forecast, By Application
9.7. Canada
9.8. Mexico
10. Europe Agrivoltaics Market Size and Forecast by Segmentation (by Value in USD Million) (2025 -2032)
10.1. Europe Market Size and Forecast, By System Design
10.2. Europe Market Size and Forecast, By Technology
10.3. Europe Agrivoltaics Market Size and Forecast, By Crop
10.4. Europe Agrivoltaics Market Size and Forecast, By Placement
10.5. Europe Agrivoltaics Market Size and Forecast, By Application
10.6. Europe Market Size and Forecast, By Country
10.6.1. United Kingdom
10.6.2. France
10.6.3. Germany
10.6.4. Italy
10.6.5. Spain
10.6.6. Sweden
10.6.7. Russia
10.6.8. Rest of Europe
11. Asia Pacific Agrivoltaics Market Size and Forecast by Segmentation (by Value in USD Million) (2025 -2032)
11.1. Asia Pacific Market Size and Forecast, By System Design
11.2. Asia Pacific Market Size and Forecast, By Technology
11.3. Asia Pacific Market Size and Forecast, By Crop
11.4. Asia Pacific Agrivoltaics Market Size and Forecast, By Placement
11.5. Asia Pacific Agrivoltaics Market Size and Forecast, By Application
11.6. Asia Pacific Market Size and Forecast, By Country
11.6.1. China
11.6.2. South Korea
11.6.3. Japan
11.6.4. India
11.6.5. Indonesia
11.6.6. Philippines
11.6.7. Rest of APAC
12. Middle East and Africa Agrivoltaics Market Size and Forecast by Segmentation (by Value in USD Million) (2025 -2032)
12.1. Middle East and Africa Market Size and Forecast, By System Design
12.2. Middle East and Africa Market Size and Forecast, By Technology
12.3. Middle East and Africa Market Size and Forecast, By Crop
12.4. Middle East and Africa Agrivoltaics Market Size and Forecast, By Placement
12.5. Middle East and Africa Agrivoltaics Market Size and Forecast, By Application
12.6. Middle East and Africa Market Size and Forecast, By Country
12.6.1. South Africa
12.6.2. GCC
12.6.3. Rest of ME&A
13. South America Agrivoltaics Market Size and Forecast by Segmentation (by Value in USD Million) (2025 -2032)
13.1. South America Market Size and Forecast, By System Design
13.2. South America Market Size and Forecast, By Technology
13.3. South America Market Size and Forecast, By Crop
13.4. South America Agrivoltaics Market Size and Forecast, By Placement
13.5. South America Agrivoltaics Market Size and Forecast, By Application
13.6. South America Market Size and Forecast, By Country
13.6.1. Brazil
13.6.2. Chile
13.6.3. Rest Of South America
14. Company Profile: Key Players
14.1. Sun’Agri
14.1.1. Company Overview
14.1.2. Business Portfolio
14.1.3. Financial Overview
14.1.4. SWOT Analysis
14.1.5. Strategic Analysis
14.1.6. Recent Developments
14.2. Enel Green Power
14.3. BayWa r.e. AG
14.4. Fraunhofer ISE
14.5. Next2Sun Technology GmbH
14.6. Insolight SA
14.7. REM TEC s.r.l.
14.8. Kyocera Corporation
14.9. Acciona Energía
14.10. EDF Renewables
14.11. Zimmermann PV-Stahlbau GmbH
14.12. Scatec ASA
14.13. Arava Power Company
14.14. Ameresco
14.15. ENGIE SA
14.16. R.Power Group
14.17. TNO
14.18. Hevel Solar
14.19. TotalEnergies SE
14.20. Trina Solar
14.21. JinkoSolar
14.22. Canadian Solar
14.23. First Solar
14.24. LONGi Green Energy Technology
14.25. Iberdrola, S.A.
14.26. RWE Renewables
14.27. Lightsource bp
14.28. Ombrea
14.29. SunPower Corporation
14.30. Namaste Solar
15. Key Findings & Analyst Recommendations
15.1. Market Trends & Insights
15.2. Investor Opportunities
15.3. Growth Strategies
16. Analyst Recommendations
17. Agrivoltaics Market – Research Methodology
17.1. Data Sources & Collection
17.2. Analysis Framework & Assumptions