Vertical Farming Market Global Industry Analysis and Forecast (2026-2032) by Technology, Application, Type, and Region.
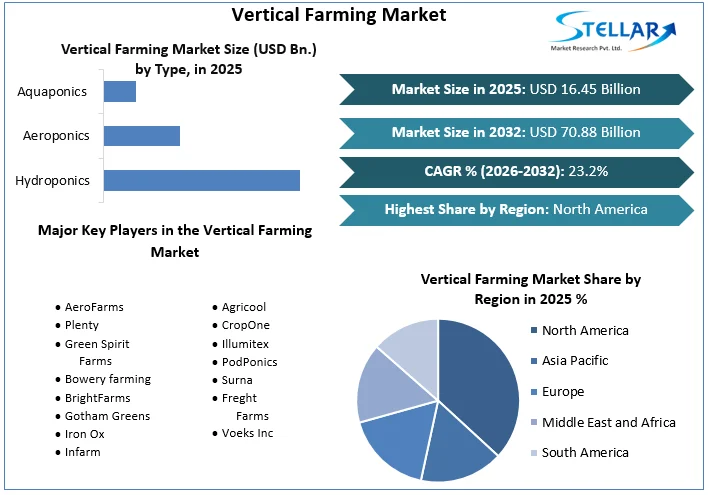
Global Vertical Farming Market size was valued at US$ 16.45 Bn. in 2025.
Vertical Farming Market Definition:
Vertical farming is done in a closed environment where plants are grown on shelves to minimize the space required for growth. Vertical farming is the process of growing crops in a vertical stack layer using artificial light and temperature. Compared to traditional farming methods, vertical farming requires less physical space, less water consumption, lower labour costs, and higher productivity. Crop such as summer squash, pepper, eggplant, melon, English cucumber, herbs, tomatoes, mushrooms is considered in vertical farming.
Vertical farming can be done through a variety of mechanisms such as hydroponics, Aquaponics, and Aeroponics. The hydroponic division is the largest in the global vertical farming market. Hydroponic farms optimize plant growth, provide fresh local produce, and minimize water, space, transportation, and pesticide use. With this mechanism, farming can be done easily.
To get more Insights: Request Free Sample Report
Vertical Farming Market Dynamics:
The growing popularity of organic food and higher yield associated is driving the growth of the global vertical farming market:
Players due to the growth of the vertical farming market include the growing popularity of organic foods, ease of crop monitoring and harvesting, reduced transportation costs, reduced area and reduced labour costs. Apart from this, higher yields associated with vertical farming than traditional farming are also giving immense growth for the market.
However, Vertical farming makes use of LED lighting fixtures and weather management, always adjusting temperature and humidity. It gives a year-spherical delivery of fresh, pesticide-free, globally grown vegetables, permitting extra manipulation over the situations wherein the flora develop. Furthermore, vertical farming gives an extensive gain in phrases of yield. It has been positioned that these products have 244 occurrences extra crop yield although the convention of 98% much less land, 95% much less water, and through 0 chemicals.
Lack of technically skilled labour and the capacity of affecting communities are hampering the growth of the market:
One of the biggest problems with vertical farming lies in the fact that it can affect and even destabilize many communities that are almost completely dependent on agriculture. Vertical farming often involves the use of technical solutions such as cameras, sensors, automated systems, artificial intelligence, hydroponic, Aquaponics, and Aeroponics systems. To operate these advanced systems, a knowledgeable and skilful workforce is essential. Lack of a skilled workforce has affected different sectors at a global level, and vertical farming is not an exception. This major restraining factor has hampered the growth of the vertical farming market.
Reduced Environmental Impact from Agriculture is creating a huge opportunity for the market:
Vertical farming plays an important role in reducing the environmental impact of agriculture. It reduces the amount of water needed to produce the same or more plants. It also eliminates the use of chemicals and pesticides used to grow crops, reducing the need for transportation. The whole process of vertical farming is carried out organically. It significantly eliminates the use of chemicals and leverages natural solutions such as the use of fish to produce nutrient-rich waste in plants with the Aquaponics growth mechanism of vertical farming. In addition, vertical farming is carried out in a controlled environment, so it is unaffected by all kinds of dangerous pests and eliminates the use of pesticides. These all qualities are atract the consumers and drives the growth of vertical farming market.
High power intake and Maintenance of Temperature, Humidity, and Air Circulation are a major challenging factors for the market:
The problem with many traditional vertical farms is that they use too much electricity and depend too much on fossil fuels for growth. In conventional soil-based agriculture, plants grow outdoors, with the help of sunlight. Since vertical rigs are designed to operate day and night all year round, 24/7 year-round cooling is required to remove the heat generated inside the vertical farm. However, maintaining a regulated air circulation throughout the vertical farm to create a uniform growing environment is a major challenge for growers.
Key Developments:
Population growth, urbanization, dwindling water supplies, and climate change continue to contribute to the reduction of arable land per capita. In addition, the advent of the Conservation Reserve Program (CRP), the emergence of the biofuel industry, and other economic factors have contributed to significant changes in land-use patterns. Because of these limitations, it is necessary to produce more from less land. This is where vertical farming helps to get more yields from different crops. As agricultural land per capita continues to decline, one possible solution is to increase productivity. Therefore, there is a need to increase the production of available land, which can be achieved through vertical farming. Vertical farming, which involves greater use of technology and automation to optimize land use, is an example of solutions to improve food production in the future. This process majorly comes under the dwindling agricultural land zone.
Vertical Farming Market Segment Analysis:
By Type, the market is segmented as Hydroponics, Aeroponics, and Aquaponics. Hydroponics dominated the market with a 41.2% share in 2020. Hydroponic farms are typically grown vertically, with LED lighting for each layer of the plant, making the most of small spaces, making them a viable option for indoor growing plants. Crops can be planted much closer together for saving space. Hydroponics, also known as soilless agriculture, is a process of growing crops without the use of soil. In this segment, the roots are grown in a liquid nutrient solution. The needs driving the installation of hydroponic farming are low installation costs, water-saving methods, ease of operation, and higher profit rates.
However, The Aeroponics segment is expected to grow at a CAGR of 8.5% through the forecast period. Aeroponics give better results in yield than soil gardening and are suitable for indoor and urban spaces and also gives bigger yields, healthier plants, has lower running costs and looks set for future developments, while hydroponics is easier to set up and manage and is suitable for most, thus this segment is predicted to give immense growth during the forecast period.

By Application, the vertical farming market is segmented as Indoor and Outdoor. The Indoor segment dominated the market with a 68.3% share in 2023. To manage this type of vertical farm, a significant compromise is required. Without significant innovation in lighting technology or automation in the direction of agriculture, which is still in its infancy, traditional vertical farms will struggle to turn a profit. Since indoor vertical farms are sealed off from the out of doors environment, there are no pests. As a result, there may be no want for insecticides or herbicides. Food grown is healthier, safer, and licensed organic, making it even greater attractive to consumers which are fuelling the growth of this segment.
Vertical Farming Market Regional Insights:
The North American region dominated the market with a 45.6% share in 2025. Strong agricultural development in these regions, as well as increased emphasis on smart farming and digitalization in agriculture, is expected to spur the growth of vertical farming in these regions this area. The United States is an important player in the North American vertical farming market. The US is dominated by major vertical farming companies including Aero Farms, Plenty Unlimited Inc., Bowery Farming, Gotham Greens, among others. The country has seen the production of many green vegetables, such as kale, arugula, lettuce, and pak choi. In 2019, there are more than 2,000 vertical farms in the United States, with 60% of the market led by small and medium businesses which are considered as a major reason for driving the growth of this region.
The Asia Pacific region is expected to grow at a CAGR of 9.5 % through the forecast period.
In the Asia Pacific, companies engaged in vertical farming are investing and expanding their operations to other countries. For example, in November 2019, Sustenir (Singapore), an agricultural technology company, opened a 30,000 square foot vertical hydroponic growing facility in Tuen Mun and Hong Kong. Hong Kong is a densely populated country with limited agricultural land. Conventional agricultural products are not enough to meet domestic and national needs and therefore depend heavily on imported products.
The objective of the report is to present a comprehensive analysis of the Global Vertical Farming market to the stakeholders in the industry. The report provides trends that are most dominant in the Global Vertical Farming market and how these trends will influence new business investments and market development throughout the forecast period. The report also aids in the comprehension of the Global Vertical Farming Market dynamics and competitive structure of the market by analyzing market leaders, market followers, and regional players.
The qualitative and quantitative data provided in the Global Vertical Farming market report is to help understand which market segments, regions are expected to grow at higher rates, factors affecting the market, and key opportunity areas, which will drive the industry and market growth through the forecast period. The report also includes the competitive landscape of key players in the industry along with their recent developments in the Global Vertical Farming market. The report studies factors such as company size, market share, market growth, revenue, production volume, and profits of the key players in the Global Vertical Farming market.
The report provides Porter's Five Force Model, which helps in designing the business strategies in the market. The report helps in identifying how many rivals are existing, who they are, and how their product quality is in the Global Vertical Farming market. The report also analyses if the Global Vertical Farming market is easy for a new player to gain a foothold in the market, do they enter or exit the market regularly if the market is dominated by a few Players, etc.
The report also includes a PESTEL Analysis, which aids in the development of company strategies. Political variables help in figuring out how much a government can influence the Global Vertical Farming market. Economic variables aid in the analysis of economic performance drivers that have an impact on the Global Vertical Farming market. Understanding the impact of the surrounding environment and the influence of environmental concerns on the Global Vertical Farming market is aided by legal factors.
Vertical Farming Market Scope:
|
Vertical Farming Market |
|
|
Market Size in 2025 |
USD 16.45 Bn. |
|
Market Size in 2032 |
USD 70.88 Bn. |
|
CAGR (2026-2032) |
23.2% |
|
Historic Data |
2020-2025 |
|
Base Year |
2025 |
|
Forecast Period |
2026-2032 |
|
Segment Scope |
by Type
|
|
by Application
|
|
|
Regional Scope |
North America- United States, Canada, and Mexico
Europe – UK, France, Germany, Italy, Spain, Sweden, Austria, and Rest of Europe Asia Pacific – China, India, Japan, South Korea, Australia, ASEAN, Rest of APAC Middle East and Africa - South Africa, GCC, Egypt, Nigeria, Rest of the Middle East and Africa South America – Brazil, Argentina, Rest of South America |
Vertical Farming Key Players:
• AeroFarms
• Plenty
• Bowery farming
• BrightFarms
• Iron Ox
• Infarm
• Agricool
• CropOne
• Illumitex
• PodPonics
• Surna
• Freght Farms
• Voeks Inc
Regional Breakdown:
Frequently Asked Questions
The North American region is expected to hold the highest share in the Global Vertical farming Market.
The market size of the Global Vertical farming Market is expected to be 70.88 Bn by 2032.
The forecast period for the Global Vertical farming Market is 2026-2032
The market size of the Global Vertical farming Market in 2025 was US$ 16.45 Bn.
1. Vertical Farming Market: Research Methodology
1.1. Research Data
1.1.1. Secondary Data
1.1.2. Primary Data
1.2. Market Size Estimation
1.2.1. Bottom-Up Approach
1.2.2. Top-Up Approach
1.3. Market Breakdown and Data Triangulation
1.4. Research Assumption
2. Vertical Farming Market: Executive Summary
3. Vertical Farming Market: Competitive Landscape
3.1. Stellar Competition Matrix
3.2. Key Players Benchmarking
3.3. Market Structure
3.3.1. Market Leaders
3.3.2. Market Followers
3.3.3. Emerging Players
3.4. Consolidation of the Market
4. Vertical Farming Market: Dynamics
4.1. Market Trends
4.2. Market Driver
4.3. Market Restraints
4.4. Market Opportunities
4.5. Market Challenges
4.6. Technology Analysis
4.6.1. HVAC Sub-system
4.6.2. Internet of Things (IoT) and Smart Devices
4.6.3. Technology Roadmap
4.7. PORTER’s Five Forces Analysis
4.8. PESTLE Analysis
4.9. Regulatory Landscape by Region
4.9.1. North America
4.9.2. Europe
4.9.3. Asia Pacific
4.9.4. Middle East and Africa
4.9.5. South America
5. Vertical Farming Market Size and Forecast by Segments (by Value in USD Mn)
5.1. Vertical Farming Market Size and Forecast, by Type (2025-2032)
5.1.1. Hydroponics
5.1.2. Aeroponics
5.1.3. Aquaponics
5.2. Vertical Farming Market Size and Forecast, By Application (2025-2032)
5.2.1. Indoor
5.2.2. Outdoor
5.3. Vertical Farming Market Size and Forecast, by Region (2025-2032)
5.3.1. North America
5.3.2. Europe
5.3.3. Asia Pacific
5.3.4. Middle East and Africa
5.3.5. South America
6. North America Vertical Farming Market Size and Forecast (by Value in USD Mn)
6.1. North America Vertical Farming Market Size and Forecast, by Type (2025-2032)
6.1.1. Hydroponics
6.1.2. Aeroponics
6.1.3. Aquaponics
6.2. North America Vertical Farming Market Size and Forecast, By Application (2025-2032)
6.2.1. Indoor
6.2.2. Outdoor
6.3. North America Vertical Farming Market Size and Forecast, by Country (2025-2032)
6.3.1. United States
6.3.2. Canada
6.3.3. Mexico
7. Europe Vertical Farming Market Size and Forecast (by Value in USD Mn)
7.1. Europe Vertical Farming Market Size and Forecast, by Type (2025-2032)
7.2. Europe Vertical Farming Market Size and Forecast, By Application (2025-2032)
7.3. Europe Vertical Farming Market Size and Forecast, by Country (2025-2032)
7.3.1. UK
7.3.2. France
7.3.3. Germany
7.3.4. Italy
7.3.5. Spain
7.3.6. Sweden
7.3.7. Austria
7.3.8. Rest of Europe
8. Asia Pacific Vertical Farming Market Size and Forecast (by Value in USD Mn)
8.1. Asia Pacific Vertical Farming Market Size and Forecast, by Type (2025-2032)
8.2. Asia Pacific Vertical Farming Market Size and Forecast, By Application (2025-2032)
8.3. Asia Pacific Vertical Farming Market Size and Forecast, by Country (2025-2032)
8.3.1. China
8.3.2. S Korea
8.3.3. Japan
8.3.4. India
8.3.5. Australia
8.3.6. Indonesia
8.3.7. Malaysia
8.3.8. Vietnam
8.3.9. Taiwan
8.3.10. Bangladesh
8.3.11. Pakistan
8.3.12. Rest of Asia Pacific
9. Middle East and Africa Vertical Farming Market Size and Forecast (by Value in USD Mn)
9.1. Middle East and Africa Vertical Farming Market Size and Forecast, by Type (2025-2032)
9.2. Middle East and Africa Vertical Farming Market Size and Forecast, By Application (2025-2032)
9.3. Middle East and Africa Single-Use Filtration Assembly Market Size and Forecast, by Country (2025-2032)
9.3.1. South Africa
9.3.2. GCC
9.3.3. Egypt
9.3.4. Nigeria
9.3.5. Rest of ME&A
10. South America Vertical Farming Market Size and Forecast (by Value in USD Mn)
10.1. South America Vertical Farming Market Size and Forecast, by Type (2025-2032)
10.2. South America Vertical Farming Market Size and Forecast, By Application (2025-2032)
10.3. South America Vertical Farming Market Size and Forecast, by Country (2025-2032)
10.3.1. Brazil
10.3.2. Argentina
10.3.3. Rest of South America
11. Company Profiles: Key Players
11.1. AeroFarms
11.1.1. Company Overview
11.1.2. Source Portfolio
11.1.3. Financial Overview
11.1.4. Business Strategy
11.1.5. Recent Developments
11.2. Plenty
11.3. Green Spirit Farms
11.4. Bowery farming
11.5. BrightFarms
11.6. Gotham Greens
11.7. Iron Ox
11.8. Infarm
11.9. Agricool
11.10. CropOne
11.11. Illumitex
11.12. PodPonics
11.13. Surna
11.14. Freght Farms
11.15. Voeks Inc.
12. Key Findings
13. Analyst Recommendations