Pool Tables Market Industry Analysis and Forecast 2026 to 2034.
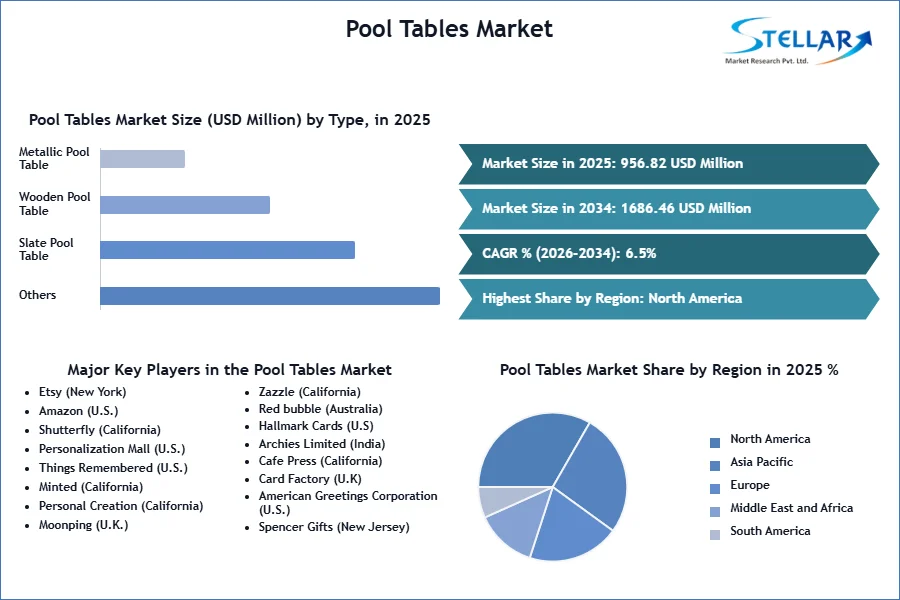
Pool Tables Market size was valued at USD 956.82 Mn. in 2025 and the total Pool Tables Market revenue is expected to grow at a CAGR of 6.50% from 2026 to 2034, reaching nearly USD 1686.46 Mn. by 2034.
Pool Tables Market Overview
A pool table serves as a dedicated furnishing designed primarily for engaging in cue sports like pool, billiards, or snooker. It features a flat, rectangular playing area, often referred to as the felt or playing surface, draped over a sturdy frame. While slate is a common choice for the playing surface, alternative materials such as wood or synthetic substances are also employed.
The comprehensive report delves into multiple facets crucial for understanding the Pool Table Market, encompassing growth, hurdles, limitations, and prospects. Employing a structured blend of qualitative and quantitative methodologies, it scrutinizes data intricately to separate patterns and market insights. Additionally, the report offers an exhaustive examination of leading players' strategies within the Pool Tables market, alongside a breakdown of market segments and regional dynamics. Especially, it furnishes vital statistics relating to import/export consumption, supply and demand dynamics, pricing trends, cost structures, revenue generation, and gross margins, positioning it as an indispensable resource for investors seeking informed decisions.
In the Pool Table Market Report, classification based on material type reveals a broad spectrum of materials employed in production, each possessing unique attributes that resonate with consumers. The segmentation offers a detailed comprehension of market dynamics, empowering manufacturers to tailor their offerings to meet precise consumer preferences and demands.
- The world exports most of its Pool table to the United States, India, and the United Kingdom.
To get more Insights: Request Free Sample Report
Pool Tables Market Dynamics
Driving Factors Behind the Surge in Pool Table Market Demand
Surged in the brand awareness of sports equipment is projected to boost the demand of the pool tables market. The rising demand in the commercial market such as the installation of pool tables in the schools and colleges has driven the market. The increase in demand for durable materials like steel, slate, etc has been a major factor that has driven the market. Additionally, rising demand for innovations in the pool table has propelled the market growth such as high-quality wood and craftsmanship for the table has boosted the market growth. Manufactures are continually introducing new and improved designs, materials, and features to meet the demand of modern consumers.
It includes the development of space-saving foldable and convertible pool tables that have been able to accommodate smaller living spaces without sacrificing the playing experience. In addition, Technological advancements in pool table manufacturing have led to improved durability, playability, and overall quality.
Navigating Market Saturation and Economic Pressures in the Pool Tables Industry
The saturation of mature markets in multiple regions is one of the main obstacles facing the global pool tables market. The prospects for significant growth in these sectors appear limited due to market saturation. As digital gaming, virtual reality, and online entertainment continue to evolve and offer a vast array of options, younger demographics increasingly gravitate toward these avenues. Consequently, the pool table industry faces substantial challenges, notably stemming from decreased consumer spending on non-essential items, like pool tables, during economic downturns.
Heightened economic uncertainty prompts consumers to curtail expenditure on discretionary products, hindering market growth. Additionally, escalating raw material costs have contributed to deferring or altogether canceling expensive leisure activities, further hampering the demand. The downturn has notably impacted revenue streams for businesses in the hospitality and entertainment sectors, encompassing bars, restaurants, and hotels, where pool tables serve as significant revenue generators. As business activities wane during economic contractions, the market for new pool tables experiences a corresponding decline.
Pool Tables Market Segment Analysis
Based on Type, The American Pool segment held the largest share in the Pool table Market in 2025 and is expected to grow with a rising CAGR through the forecast period (2026-2034). The American Pool Table market has seen consistent growth in recent years, driven by the surging popularity of billiards as a leisure pursuit. The trend is further bolstered by the emergence of pool tournaments and leagues, alongside the proliferation of pool-centric venues such as bars and entertainment spots. Consequently, manufacturers and vendors are constantly innovating to meet the changing demands of consumers, with new products regularly introduced to the market. Projections suggest that this upward trend will persist, with substantial sales and revenue growth anticipated in the foreseeable future.
Based on Material Type, the Slate segment dominated the market and is expected to rise with a growing CAGR till 2034. The increased demand for the slate pool table owing to its durability has influenced the market growth. A slate pool table considered a cornerstone of the industry, embodies unparalleled durability and accuracy. Celebrated for its top-tier playing surface constructed from slate, the category of pool table is highly sought after by both aficionados and professionals thanks to its outstanding performance and extended lifespan.
Pool Tables Market Regional Analysis
North America dominated the pool table market and is expected to maintain dominance through 2034 owing to the high focus on innovation by producers and initiatives taken by the governing bodies that have propelled the market growth in the region. The surge in the popularity of pool tournaments and leagues as well as the increasing popularity of billiards has accelerated the growth of the pool tables market. Additionally, the rising number of pool halls, bars, and entertainment venues featuring pool tables has also fuelled the demand for American pool tables. With the increasing consumer purchasing power and many associations promoting the sport, the region accounted for the most significant global pool tables market revenue.
Asia Pacific is estimated to be the fastest growing region and is projected to increase through the forecast period thanks to the major global export and manufacturers of pool tables being from China. The Asia-Pacific pool tables market is propelled by a keen interest in cue sports and a notable surge in indoor sports activities. The region's affluent consumers, coupled with the establishment of malls and commercial hubs catering to pool and billiards enthusiasts, are anticipated to spur demand for pool tables. Additionally, heightened competition among players, along with sponsorships, is poised to positively impact the market by driving participation levels. The increasing e-commerce landscape and the presence of organized retail chains are further contributing to the growing need for pool tables, particularly in countries like India where pool games enjoy significant popularity.
- The top 3 importers of Billiard tables are the United States with 14,867 shipments followed by the Netherlands with 5,840 and Germany at the 3rd spot with 5,522 shipments.
- The top 3 exporters of Pool Table are India with 19,190 shipments followed by China with 10,219 and Vietnam at the 3rd spot with 614 shipments.
- The country with the largest global export quantity and manufacturers of pool or billiards tables is China, with the European market coming in second.
Pool Tables Market Competitive Landscape
- In October 2022, Sawyer Twain launched a new line of Nixon Billiards to the North American market. Featured in the Nixon Billiards line are the Desyn, a mid-century modern table; the prominent Kai table; and the Birdy, a contemporary chic billiards table with a carefully crafted refectory design that stands alone in being the first of its kind with modern tapered rails.
- In May 2022, FCI Billiards, a leading provider of billiard supplies, pool tables, and game room accessories, announced the opening of a brand new 2,000 sq. ft. showroom location in Joplin. Visitors to the showroom will find a wide selection of products, including pool cues, pool cue cases, cue shafts, and table accessories such as billiard balls and tablecloths.
- In May 2021, Bugatti launched a USD 300,000 pool table with gyroscopic self-leveling. The pool was designed by Bugatti and includes a 13-inch screen to keep track of scores, a carbon-fiber frame, and more. It used CNC-machined and anodized aluminum sides, stainless-steel ball pockets layered with leather, and titanium nuts and screws.
|
Pool Tables Market Scope |
|
|
Market Size in 2025 |
USD 956.82 Mn. |
|
Market Size in 2034 |
USD 1686.46 Mn. |
|
CAGR (2026-2034) |
6.50 % |
|
Historic Data |
2020-2025 |
|
Base Year |
2025 |
|
Forecast Period |
2026-2034 |
|
Segments |
By Type
|
|
By Material Type
|
|
|
By End Use
|
|
|
By Distribution Channel
|
|
|
Regional Scope |
North America- United States, Canada, and Mexico Europe – United Kingdom, France, Germany, Italy, Spain, Sweden, Russia, and Rest of Europe Asia Pacific – China, India, Japan, South Korea, Australia, ASEAN, Rest of APAC Middle East and Africa - South Africa, GCC, Egypt, Rest of the Middle East and Africa South America – Brazil, Argentina, Rest of South America |
Pool Tables Market Key Players
- Olhausen Billiard MFG Inc.
- Diamond Billiard Products Inc.
- Rene Pierre
- Chevillotte
- Legacy Billiards
- Valley-Dynamo Inc.
- Blatt Billiards Corp.
- Imperial Billiards
- Gabriels Billiards
- Riley England
- Pammi Billiards
- Vanshika Billiards
- Brunswick Billiards
- Rasson Sports Equipment (Shenzhen) Co., Ltd.
- Yalin Billiard Goods Co., Ltd.
- Siboasi Sports Goods Technology Co., Ltd.
- Huizhou Double Star Sports Goods Co., Ltd.
- Guangzhou H.J. Sport Product Co., Ltd.
- Guangzhou J&J Billiards Limited
- XXX Inc
Frequently Asked Questions
High Cost has restrained the market growth.
The Market size was valued at USD 956.82 Million in 2025 and the total Market revenue is expected to grow at a CAGR of 6.50 % from 2026 to 2034, reaching nearly USD 1686.46 Million.
The segments covered in the market report are by booking mode, price range, and accommodation type.
1. Pool Tables Market: Research Methodology
1.1. Research Data
1.1.1. Primary Data
1.1.2. Secondary Data
1.2. Market Size Estimation
1.2.1. Bottom-Up Approach
1.2.2. Top-Down Approach
1.3. Market breakdown and Data Triangulation
1.4. Assumptions
2. Pool Tables Market: Executive Summary
2.1. Market Overview
2.2. Market Size (2025) and Forecast (2026 – 2034) and Y-O-Y%
2.3. Market Size (USD) and Market Share (%) – By Segments and Regions
3. Pool Tables Market: Competitive Landscape
3.1. Stellar Competition Matrix
3.2. Key Players Benchmarking
3.2.1. Company Name
3.2.2. Headquarter
3.2.3. Product Segment
3.2.4. End-user Segment
3.2.5. Y-O-Y%
3.2.6. Revenue (2025)
3.2.7. Profit Margin
3.2.8. Market Share
3.2.9. Company Locations
3.3. Market Structure
3.3.1. Market Leaders
3.3.2. Market Followers
3.3.3. Emerging Players
3.4. Consolidation of the Market
3.4.1. Strategic Initiatives and Developments
3.4.2. Mergers and Acquisitions
3.4.3. Collaborations and Partnerships
3.4.4. Product Launches and Innovation
4. Pool Tables Market: Dynamics
4.1. Market Trends by Region
4.1.1. North America
4.1.2. Europe
4.1.3. Asia Pacific
4.1.4. Middle East and Africa
4.1.5. South America
4.2. Market Drivers
4.3. Market Restraints
4.4. Market Opportunities
4.5. Market Challenges
4.6. PORTER’s Five Forces Analysis
4.6.1. Intensity of the Rivalry
4.6.2. Threat of New Entrants
4.6.3. Bargaining Power of Suppliers
4.6.4. Bargaining Power of Buyers
4.6.5. Threat of Substitutes
4.7. PESTLE Analysis
4.7.1. Political Factors
4.7.2. Economic Factors
4.7.3. Social Factors
4.7.4. Technological Factors
4.7.5. Legal Factors
4.7.6. Environmental Factors
4.8. Technological Roadmap
4.9. Value Chain Analysis
4.10. Regulatory Landscape by Region
4.10.1. North America
4.10.2. Europe
4.10.3. Asia Pacific
4.10.4. Middle East and Africa
4.10.5. South America
5. Pool Tables Market Size and Forecast by Segments (by Value USD Million and Volume in Units)
5.1. Pool Tables Market Size and Forecast, By Type (2026-2034)
5.1.1. American Pool Tables
5.1.2. English Pool Tables
5.1.3. Others
5.2. Pool Tables Market Size and Forecast, By Material Type (2026-2034)
5.2.1. Slate Pool Table
5.2.2. Wooden Pool Table
5.2.3. Metallic Pool Table
5.2.4. Other
5.3. Pool Tables Market Size and Forecast, By End Use (2026-2034)
5.3.1. Household
5.3.2. Commercial
5.3.3. Professional
5.4. Pool Tables Market Size and Forecast, By Distribution Channel (2026-2034)
5.4.1. Online
5.4.2. Offline
5.5. Pool Tables Market Size and Forecast, by Region (2026-2034)
5.5.1. North America
5.5.2. Europe
5.5.3. Asia Pacific
5.5.4. Middle East and Africa
5.5.5. South America
6. North America Pool Tables Market Size and Forecast (by Value USD Million and Volume in Units)
6.1. North America Pool Tables Market Size and Forecast, By Type (2026-2034)
6.1.1. American Pool Tables
6.1.2. English Pool Tables
6.1.3. Others
6.2. North America Pool Tables Market Size and Forecast, By Material Type (2026-2034)
6.2.1. Slate Pool Table
6.2.2. Wooden Pool Table
6.2.3. Metallic Pool Table
6.2.4. Other
6.3. North America Pool Tables Market Size and Forecast, By End Use (2026-2034)
6.3.1. Household
6.3.2. Commercial
6.3.3. Professional
6.4. North America Pool Tables Market Size and Forecast, By Distribution Channel (2026-2034)
6.4.1. Online
6.4.2. Offline
6.5. North America Pool Tables Market Size and Forecast, by Country (2026-2034)
6.5.1. United States
6.5.2. Canada
6.5.3. Mexico
7. Europe Pool Tables Market Size and Forecast (by Value USD Million and Volume in Units)
7.1. Europe Pool Tables Market Size and Forecast, By Type (2026-2034)
7.2. Europe Pool Tables Market Size and Forecast, By Material Type (2026-2034)
7.3. Europe Pool Tables Market Size and Forecast, By End Use (2026-2034)
7.4. Europe Pool Tables Market Size and Forecast, By Distribution Channel (2026-2034)
7.5. Europe Pool Tables Market Size and Forecast, by Country (2026-2034)
7.5.1. UK
7.5.2. France
7.5.3. Germany
7.5.4. Italy
7.5.5. Spain
7.5.6. Sweden
7.5.7. Austria
7.5.8. Rest of Europe
8. Asia Pacific Pool Tables Market Size and Forecast (by Value USD Million and Volume in Units)
8.1. Asia Pacific Pool Tables Market Size and Forecast, By Type (2026-2034)
8.2. Asia Pacific Pool Tables Market Size and Forecast, By Material Type (2026-2034)
8.3. Asia Pacific Pool Tables Market Size and Forecast, By End Use (2026-2034)
8.4. Asia Pacific Pool Tables Market Size and Forecast, By Distribution Channel (2026-2034)
8.5. Asia Pacific Pool Tables Market Size and Forecast, by Country (2026-2034)
8.5.1. China
8.5.2. S Korea
8.5.3. Japan
8.5.4. India
8.5.5. Australia
8.5.6. Indonesia
8.5.7. Malaysia
8.5.8. Vietnam
8.5.9. Taiwan
8.5.10. Bangladesh
8.5.11. Pakistan
8.5.12. Rest of Asia Pacific
9. Middle East and Africa Pool Tables Market Size and Forecast (by Value USD Million and Volume in Units)
9.1. Middle East and Africa Pool Tables Market Size and Forecast, By Type (2026-2034)
9.2. Middle East and Africa Pool Tables Market Size and Forecast, By Material Type (2026-2034)
9.3. Middle East and Africa Pool Tables Market Size and Forecast, By End Use (2026-2034)
9.4. Middle East and Africa Pool Tables Market Size and Forecast, By Distribution Channel (2026-2034)
9.5. Middle East and Africa Pool Tables Market Size and Forecast, by Country (2026-2034)
9.5.1. South Africa
9.5.2. GCC
9.5.3. Egypt
9.5.4. Nigeria
9.5.5. Rest of ME&A
10. South America Pool Tables Market Size and Forecast (by Value USD Million and Volume in Units)
10.1. South America Pool Tables Market Size and Forecast, By Type (2026-2034)
10.2. South America Pool Tables Market Size and Forecast, By Material Type (2026-2034)
10.3. South America Pool Tables Market Size and Forecast, By End Use (2026-2034)
10.4. South America Pool Tables Market Size and Forecast, By Distribution Channel (2026-2034)
10.5. South America Pool Tables Market Size and Forecast, by Country (2026-2034)
10.5.1. Brazil
10.5.2. Argentina
10.5.3. Rest of South America
11. Company Profile: Key players
11.1. Olhausen Billiard MFG Inc.
11.1.1. Company Overview
11.1.2. Product Segment
11.1.2.1. Product Name
11.1.2.2. Product Details (Price, Features, etc.)
11.1.3. Financial Overview
11.1.3.1. Total Revenue
11.1.3.2. Segment Revenue
11.1.3.3. Regional Revenue
11.1.4. SWOT Analysis
11.1.5. Strategic Analysis
11.1.6. Recent Developments
11.2. Diamond Billiard Products Inc.
11.3. Rene Pierre
11.4. Chevillotte
11.5. Legacy Billiards
11.6. Valley-Dynamo Inc.
11.7. Blatt Billiards Corp.
11.8. Imperial Billiards
11.9. Gabriels Billiards
11.10. Riley England
11.11. Pammi Billiards
11.12. Vanshika Billiards
11.13. Brunswick Billiards
11.14. Rasson Sports Equipment (Shenzhen) Co., Ltd.
11.15. Yalin Billiard Goods Co., Ltd.
11.16. Siboasi Sports Goods Technology Co., Ltd.
11.17. Huizhou Double Star Sports Goods Co., Ltd.
11.18. Guangzhou H.J. Sport Product Co., Ltd.
11.19. Guangzhou J&J Billiards Limited
11.20. XXX Inc
12. Key Findings
13. Industry Recommendations
13.1. Strategic Recommendations
13.2. Future Outlook