Paper Products Market Industry Analysis and Forecast (2026-2032)
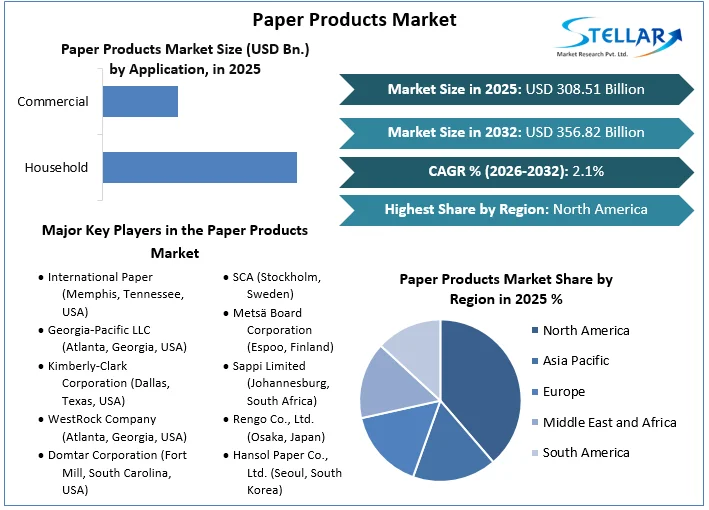
The Paper Products Market size was valued at USD 308.51 Bn. in 2025 and the total Global Paper Products revenue is expected to grow at a CAGR of 2.10 % from 2026 to 2032, reaching nearly USD 356.82 Bn. by 2032.
Paper Products Market Overview
The Paper Products Market encompasses a wide range of products made from paper and paperboard materials, including packaging, printing and writing papers, tissues, and specialty papers. These products serve various industries such as packaging, publishing, hygiene, and others, catering to both consumer and industrial needs. The research methodology employed in studying the Paper Products Market typically involves a combination of qualitative and quantitative approaches. Qualitative research may include comprehensive literature reviews, interviews with industry experts, and analysis of industry reports and publications to understand market trends, dynamics, and challenges.
Quantitative research involves gathering and analyzing numerical data related to market size, growth rates, revenue, and other relevant metrics. This may include surveys, data mining, and statistical analysis of market data from reputable sources such as industry associations, government agencies, and market research firms. By combining these methodologies, researchers can gain a comprehensive understanding of the Paper Products Market, including its size, growth drivers, competitive landscape, and future outlook. This enables stakeholders to make informed decisions regarding investments, product development, marketing strategies, and more within the paper products industry.
To get more Insights: Request Free Sample Report
Paper Products Market Dynamics
The Paper Products Market is driven by several key factors that shape its growth trajectory. Firstly, increasing environmental awareness and sustainability concerns have led to a growing preference for eco-friendly paper products, driving demand for recycled and biodegradable options. Additionally, the rising e-commerce sector has spurred demand for packaging materials, boosting the market for corrugated boxes, wrapping paper, and other packaging products. Moreover, technological advancements in the paper manufacturing process have improved efficiency and reduced costs, further fuelling market growth.
Opportunities abound within the Paper Products Market, particularly in emerging economies where urbanization and industrialization are on the rise. These regions offer untapped potential for paper products across various sectors, including packaging, printing, and hygiene. Furthermore, the shift towards digitalization has opened up new avenues for innovation in specialty paper products, such as digital printing papers and smart packaging solutions. Additionally, collaborations between paper manufacturers and technology companies present opportunities to develop advanced paper-based products with enhanced functionalities, catering to evolving consumer demands and industry requirements.
Key Stakeholders of Paper Products Development Continued emphasis on sustainability presents a significant opportunity for the Paper Products Market. As consumers and businesses increasingly prioritize environmentally friendly practices, there is a growing demand for paper products sourced from responsibly managed forests and produced using eco-friendly processes. This trend not only drives the adoption of sustainable paper products but also encourages innovation in recycling technologies and alternative fiber sources, such as agricultural residues and non-wood fibers.
Also, the ongoing global focus on hygiene and sanitation, particularly in the wake of public health crises like the COVID-19 pandemic, has heightened demand for paper-based hygiene products. Items such as tissue paper, paper towels, and sanitary napkins have witnessed increased consumption, creating opportunities for market expansion and product diversification. Additionally, advancements in paper-based technologies, such as antimicrobial coatings and barrier properties, offer new possibilities for the development of hygienic and protective paper products.
The growing trend towards customization and personalization presents opportunities for niche segments within the Paper Products Market. With advancements in digital printing and manufacturing technologies, there is a growing demand for customized packaging, specialty papers, and personalized stationery products. This trend caters to the unique preferences of consumers and businesses, opening up avenues for product differentiation and premiumization within the market.
|
Country |
No. of Mills |
Production Rate Per Country (%) |
|
Maharashtra |
63 |
18% |
|
Andhra Pradesh |
19 |
13% |
|
Madhya Pradesh |
18 |
6.62% |
|
Karnataka |
17 |
5.48% |
|
Gujrat |
55 |
- |
|
Uttar Pradesh |
68 |
9% |
|
Odisha |
8 |
6% |
|
Tamil Nadu |
24 (small Sized mills) |
- |
|
Panjab |
23 |
- |
|
Haryana |
18 |
- |
Paper Products Market Segment Analysis
By Product Type
The hygienic product segment within the Paper Products Market includes items such as tissue papers, paper towels, and sanitary napkins. This segment experiences steady demand driven by factors such as increasing awareness of hygiene practices, population growth, and changing consumer lifestyles. The rise in disposable income levels, particularly in emerging economies, further boosts the consumption of hygienic paper products. Stationery products encompass a wide range of items such as notebooks, writing pads, envelopes, and greeting cards. This segment caters to both consumer and commercial markets, with demand influenced by factors such as education levels, office culture, and seasonal trends. The stationery product segment often experiences fluctuations in demand based on back-to-school seasons, holiday periods, and corporate procurement cycles.
Packaging products represent a significant segment within the Paper Products Market, including corrugated boxes, cartons, wrapping paper, and packaging inserts. This segment serves diverse industries such as food and beverage, retail, pharmaceuticals, and e-commerce. Factors driving demand for packaging products include the growth of online shopping, increased focus on sustainable packaging solutions, and regulatory requirements for product safety and labeling. This segment encompasses a variety of paper products not covered under the hygienic, stationery, or packaging categories. This may include specialty papers, art papers, construction papers, and industrial papers used in applications such as insulation and filtration. Demand within this segment is influenced by specific industry needs, technological advancements, and niche consumer preferences.
By Application
The household application segment includes paper products used within residential settings for various purposes such as hygiene, stationery, and packaging. Household demand for paper products is driven by factors such as population growth, household disposable income, and lifestyle changes. Common household paper products include toilet paper, facial tissues, paper bags, and gift wraps.
The commercial application segment encompasses paper products used in commercial and institutional settings, including offices, schools, healthcare facilities, and retail stores. Demand within this segment is influenced by factors such as business activities, educational enrollment, healthcare needs, and retail trends. Commercial paper products may include office stationery, educational materials, medical disposables, and retail packaging solutions in the Paper Products Market.
By Distribution Channel
The emergence of e-commerce has transformed the distribution landscape for paper products in the Paper Products Market, offering convenience, accessibility, and a wide product assortment to consumers. E-commerce platforms serve as key distribution channels for both retail and bulk purchases of paper products, catering to diverse customer segments. Factors driving the growth of e-commerce stores include increasing internet penetration, smartphone adoption, and the convenience of online shopping.
Offline stores encompass traditional brick-and-mortar retail outlets, supermarkets, convenience stores, specialty shops, and wholesalers. These physical stores remain a significant distribution channel for paper products, offering consumers the opportunity to physically inspect and purchase items. Factors such as proximity to consumers, brand visibility, and customer service play a crucial role in the success of offline stores. Additionally, offline stores provide opportunities for product demonstrations, promotions, and personalized customer interactions, enhancing the overall shopping experience.

Paper Products Market Regional Insight
China and the United States stand out as the two largest paper-producing countries globally, with distinct trends shaping their respective markets.
China has emerged as a powerhouse in the global Paper Products Market, boasting a remarkable surge in paper production over the past few decades. In 2025, China's paper production reached an impressive 117 million metric tons, representing a significant milestone in its industrial growth. This surge in production can be attributed to several factors, including rapid urbanization, industrialization, and economic expansion. Additionally, China's large population and growing consumer demand for paper products, fueled by rising disposable incomes and lifestyle changes, have further stimulated production. The country's robust paper manufacturing sector serves both domestic consumption and international markets, contributing to its status as a leading player in the global paper products industry.
In contrast, the United States has experienced a gradual decline in paper production in recent decades, a trend influenced by factors such as digitization, technological advancements, and shifting consumer preferences. While the United States remains a significant player in the global Paper Products Market, its production levels have not kept pace with those of China. In 2020, the U.S. produced approximately half the volume of paper compared to China, reflecting a notable disparity between the two countries.
Despite this decline, the United States maintains a strong presence in the paper products industry, supported by its advanced manufacturing capabilities, established infrastructure, and diverse product offerings. However, market dynamics continue to evolve as the industry adapts to changing consumer behavior, sustainability concerns, and emerging technologies. China and the United States play pivotal roles in shaping the global paper products market, each contributing unique dynamics and opportunities to the industry landscape. While China's rapid growth underscores its dominance in production volume, the United States' enduring presence underscores its innovation and adaptability in a competitive market environment.
|
Paper Products Market Scope |
|
|
Market Size in 2025 |
USD 308.51 Bn. |
|
Market Size in 2032 |
USD 356.82 Bn. |
|
CAGR (2026-2032) |
2.10% |
|
Historic Data |
2020-2025 |
|
Base Year |
2025 |
|
Forecast Period |
2026-2032 |
|
Segments |
By Product Type Hygienic Product Stationery Product Packaging Products Others
By Application Household Commercial
By Distribution Channel E-commerce Stores Offline Stores |
|
Regional Scope |
North America- United States, Canada, and Mexico Europe – UK, France, Germany, Italy, Spain, Sweden, Russia, and Rest of Europe Asia Pacific – China, India, Japan, South Korea, Australia, ASEAN, Rest of APAC Middle East and Africa - South Africa, GCC, Egypt, Nigeria, Rest of the Middle East and Africa South America – Brazil, Argentina, Rest of South America |
Key Players in the Paper Products Market
- International Paper (Memphis, Tennessee, USA)
- Georgia-Pacific LLC (Atlanta, Georgia, USA)
- Kimberly-Clark Corporation (Dallas, Texas, USA)
- WestRock Company (Atlanta, Georgia, USA)
- Domtar Corporation (Fort Mill, South Carolina, USA)
- Mondi Group (Vienna, Austria)
- UPM-Kymmene Corporation (Helsinki, Finland)
- Smurfit Kappa Group plc (Dublin, Ireland)
- Stora Enso Oyj (Helsinki, Finland)
- Nine Dragons Paper (Holdings) Limited (Hong Kong)
- Oji Holdings Corporation (Tokyo, Japan)
- Nippon Paper Industries Co., Ltd. (Tokyo, Japan)
- Lee & Man Paper Manufacturing Ltd. (Hong Kong)
- Shandong Sun Paper Industry Joint Stock Co., Ltd. (Yanzhou, China)
- SCA (Stockholm, Sweden)
- Metsä Board Corporation (Espoo, Finland)
- Sappi Limited (Johannesburg, South Africa)
- Rengo Co., Ltd. (Osaka, Japan)
- Hansol Paper Co., Ltd. (Seoul, South Korea)
- Oji Holdings Corporation (Tokyo, Japan)
- Norske Skog (Oslo, Norway)
- Daio Paper Corporation (Tokyo, Japan)
- BillerudKorsnäs AB (Solna, Sweden)
- Packaging Corporation of America (Lake Forest, Illinois, USA)
- Lee & Man Paper Manufacturing Ltd. (Kowloon, Hong Kong)
Frequently Asked Questions
North America has the largest paper product market share in the world.
The market size of Paper Products by 2032 is expected to reach USD 356.82 Bn.
The market size of the Paper Products in 2025 was valued at USD 308.51 Bn.
International Paper (Memphis, Tennessee, USA), Georgia-Pacific LLC (Atlanta, Georgia, USA) Kimberly-Clark Corporation (Dallas, Texas, USA), etc.
1. Paper Products Market Introduction
1.1. Study Assumption and Market Definition
1.2. Scope of the Study
1.3. Executive Summary
2. Global Paper Products Market: Competitive Landscape
2.1. SMR Competition Matrix
2.2. Competitive Landscape
2.3. Key Players Benchmarking
2.3.1. Company Name
2.3.2. Business Segment
2.3.3. End-user Segment
2.3.4. Revenue (2025)
2.3.5. Company Locations
2.4. Market Structure
2.4.1. Market Leaders
2.4.2. Market Followers
2.4.3. Emerging Players
2.5. Mergers and Acquisitions Details
3. Paper Products Market: Dynamics
3.1. Paper Products Market Trends
3.2. Paper Products Market Dynamics
3.2.1. Global Paper Products Market Drivers
3.2.2. Global Paper Products Market Restraints
3.2.3. Global Paper Products Market Opportunities
3.2.4. Global Paper Products Market Challenges
3.3. Key Stakeholders of Paper Products Development
3.4. Ecotourism and Paper Products Development
3.5. Paper Products Development and the Rise of Slow Tourism
3.6. PORTER’s Five Forces Analysis
3.7. PESTLE Analysis
3.8. Technology Roadmap
3.9. Regulatory Landscape by Region
3.9.1. North America
3.9.2. Europe
3.9.3. Asia Pacific
3.9.4. Middle East and Africa
3.9.5. South America
3.10. Key Opinion Leader Analysis for the Paper Products Industry
4. Paper Products Market: Global Market Size and Forecast by Segmentation (by Value in USD Million) (2025-2032)
4.1. Paper Products Market Size and Forecast, By Product Type (2025-2032)
4.1.1. Hygienic Product
4.1.2. Stationery Product
4.1.3. Packaging Products
4.1.4. Others
4.2. Paper Products Market Size and Forecast, By Application (2025-2032)
4.2.1. Household
4.2.2. Commercial
4.3. Paper Products Market Size and Forecast, By Distribution Channel (2025-2032)
4.3.1. E-commerce Stores
4.3.2. Offline Stores
4.4. Paper Products Market Size and Forecast, by Region (2025-2032)
4.4.1. North America
4.4.2. Europe
4.4.3. Asia Pacific
4.4.4. Middle East and Africa
4.4.5. South America
5. North America Paper Products Market Size and Forecast by Segmentation (by Value in USD Million) (2025-2032)
5.1. North America Paper Products Market Size and Forecast, By Product Type (2025-2032)
5.1.1. Hygienic Product
5.1.2. Stationery Product
5.1.3. Packaging Products
5.1.4. Others
5.2. North America Paper Products Market Size and Forecast, By Application(2025-2032)
5.2.1. Household
5.2.2. Commercial
5.3. North America Paper Products Market Size and Forecast, By Distribution Channel (2025-2032)
5.3.1. E-commerce Stores
5.3.2. Offline Stores
5.4. North America Paper Products Market Size and Forecast, by Country (2025-2032)
5.4.1. United States
5.4.1.1. United States Paper Products Market Size and Forecast, By Product Type (2025-2032)
5.4.1.1.1. Hygienic Product
5.4.1.1.2. Stationery Product
5.4.1.1.3. Packaging Products
5.4.1.1.4. Others
5.4.1.2. United States Paper Products Market Size and Forecast, By Application (2025-2032)
5.4.1.2.1. Household
5.4.1.2.2. Commercial
5.4.1.3. United States Paper Products Market Size and Forecast, By Distribution Channel (2025-2032)
5.4.1.3.1. E-commerce Stores
5.4.1.3.2. Offline Stores
5.4.2. Canada
5.4.2.1. Canada Paper Products Market Size and Forecast, By Product Type (2025-2032)
5.4.2.1.1. Hygienic Product
5.4.2.1.2. Stationery Product
5.4.2.1.3. Packaging Products
5.4.2.1.4. Others
5.4.2.2. Canada Paper Products Market Size and Forecast, By Application(2025-2032)
5.4.2.2.1. Household
5.4.2.2.2. Commercial
5.4.3. Canada Paper Products Market Size and Forecast, By Distribution Channel (2025-2032)
5.4.3.1.1. E-commerce Stores
5.4.3.1.2. Offline Stores
5.4.4. Mexico
5.4.4.1. Mexico Paper Products Market Size and Forecast, By Product Type (2025-2032)
5.4.4.1.1. Hygienic Product
5.4.4.1.2. Stationery Product
5.4.4.1.3. Packaging Products
5.4.4.1.4. Others
5.4.4.2. Mexico Paper Products Market Size and Forecast, By Application(2025-2032)
5.4.4.2.1. Household
5.4.4.2.2. Commercial
5.4.4.3. Mexico Paper Products Market Size and Forecast, By Distribution Channel (2025-2032)
5.4.4.3.1. E-commerce Stores
5.4.4.3.2. Offline Stores
6. Europe Paper Products Market Size and Forecast by Segmentation (by Value in USD Million) (2025-2032)
6.1. Europe Paper Products Market Size and Forecast, By Product Type (2025-2032)
6.2. Europe Paper Products Market Size and Forecast, By Application(2025-2032)
6.3. Europe Paper Products Market Size and Forecast, By Distribution Channel (2025-2032)
6.4. Europe Paper Products Market Size and Forecast, by Country (2025-2032)
6.4.1. United Kingdom
6.4.1.1. United Kingdom Paper Products Market Size and Forecast, By Product Type (2025-2032)
6.4.1.2. United Kingdom Paper Products Market Size and Forecast, By Application(2025-2032)
6.4.1.3. United Kingdom Paper Products Market Size and Forecast, By Distribution Channel(2025-2032)
6.4.2. France
6.4.2.1. France Paper Products Market Size and Forecast, By Product Type (2025-2032)
6.4.2.2. France Paper Products Market Size and Forecast, By Application(2025-2032)
6.4.2.3. France Paper Products Market Size and Forecast, By Distribution Channel(2025-2032)
6.4.3. Germany
6.4.3.1. Germany Paper Products Market Size and Forecast, By Product Type (2025-2032)
6.4.3.2. Germany Paper Products Market Size and Forecast, By Application(2025-2032)
6.4.3.3. Germany Paper Products Market Size and Forecast, By Distribution Channel (2025-2032)
6.4.4. Italy
6.4.4.1. Italy Paper Products Market Size and Forecast, By Product Type (2025-2032)
6.4.4.2. Italy Paper Products Market Size and Forecast, By Application(2025-2032)
6.4.4.3. Italy Paper Products Market Size and Forecast, By Distribution Channel(2025-2032)
6.4.5. Spain
6.4.5.1. Spain Paper Products Market Size and Forecast, By Product Type (2025-2032)
6.4.5.2. Spain Paper Products Market Size and Forecast, By Application(2025-2032)
6.4.5.3. Spain Paper Products Market Size and Forecast, By Distribution Channel (2025-2032)
6.4.6. Sweden
6.4.6.1. Sweden Paper Products Market Size and Forecast, By Product Type (2025-2032)
6.4.6.2. Sweden Paper Products Market Size and Forecast, By Application(2025-2032)
6.4.6.3. Sweden Paper Products Market Size and Forecast, By Distribution Channel (2025-2032)
6.4.7. Austria
6.4.7.1. Austria Paper Products Market Size and Forecast, By Product Type (2025-2032)
6.4.7.2. Austria Paper Products Market Size and Forecast, By Application(2025-2032)
6.4.7.3. Austria Paper Products Market Size and Forecast, By Distribution Channel (2025-2032)
6.4.8. Rest of Europe
6.4.8.1. Rest of Europe Paper Products Market Size and Forecast, By Product Type (2025-2032)
6.4.8.2. Rest of Europe Paper Products Market Size and Forecast, By Application(2025-2032)
6.4.8.3. Rest of Europe Paper Products Market Size and Forecast, By Distribution Channel (2025-2032)
7. Asia Pacific Paper Products Market Size and Forecast by Segmentation (by Value in USD Million) (2025-2032)
7.1. Asia Pacific Paper Products Market Size and Forecast, By Product Type (2025-2032)
7.2. Asia Pacific Paper Products Market Size and Forecast, By Application(2025-2032)
7.3. Asia Pacific Paper Products Market Size and Forecast, By Distribution Channel (2025-2032)
7.4. Asia Pacific Paper Products Market Size and Forecast, by Country (2025-2032)
7.4.1. China
7.4.1.1. China Paper Products Market Size and Forecast, By Product Type (2025-2032)
7.4.1.2. China Paper Products Market Size and Forecast, By Application(2025-2032)
7.4.1.3. China Paper Products Market Size and Forecast, By Distribution Channel (2025-2032)
7.4.2. S Korea
7.4.2.1. S Korea Paper Products Market Size and Forecast, By Product Type (2025-2032)
7.4.2.2. S Korea Paper Products Market Size and Forecast, By Application(2025-2032)
7.4.2.3. S Korea Paper Products Market Size and Forecast, By Distribution Channel (2025-2032)
7.4.3. Japan
7.4.3.1. Japan Paper Products Market Size and Forecast, By Product Type (2025-2032)
7.4.3.2. Japan Paper Products Market Size and Forecast, By Application(2025-2032)
7.4.3.3. Japan Paper Products Market Size and Forecast, By Distribution Channel (2025-2032)
7.4.4. India
7.4.4.1. India Paper Products Market Size and Forecast, By Product Type (2025-2032)
7.4.4.2. India Paper Products Market Size and Forecast, By Application(2025-2032)
7.4.4.3. India Paper Products Market Size and Forecast, By Distribution Channel (2025-2032)
7.4.5. Australia
7.4.5.1. Australia Paper Products Market Size and Forecast, By Product Type (2025-2032)
7.4.5.2. Australia Paper Products Market Size and Forecast, By Application(2025-2032)
7.4.5.3. Australia Paper Products Market Size and Forecast, By Distribution Channel (2025-2032)
7.4.6. Indonesia
7.4.6.1. Indonesia Paper Products Market Size and Forecast, By Product Type (2025-2032)
7.4.6.2. Indonesia Paper Products Market Size and Forecast, By Application(2025-2032)
7.4.6.3. Indonesia Paper Products Market Size and Forecast, By Distribution Channel (2025-2032)
7.4.7. Malaysia
7.4.7.1. Malaysia Paper Products Market Size and Forecast, By Product Type (2025-2032)
7.4.7.2. Malaysia Paper Products Market Size and Forecast, By Application(2025-2032)
7.4.7.3. Malaysia Paper Products Market Size and Forecast, By Distribution Channel (2025-2032)
7.4.8. Vietnam
7.4.8.1. Vietnam Paper Products Market Size and Forecast, By Product Type (2025-2032)
7.4.8.2. Vietnam Paper Products Market Size and Forecast, By Application(2025-2032)
7.4.8.3. Vietnam Paper Products Market Size and Forecast, By Distribution Channel(2025-2032)
7.4.9. Taiwan
7.4.9.1. Taiwan Paper Products Market Size and Forecast, By Product Type (2025-2032)
7.4.9.2. Taiwan Paper Products Market Size and Forecast, By Application(2025-2032)
7.4.9.3. Taiwan Paper Products Market Size and Forecast, By Distribution Channel (2025-2032)
7.4.10. Rest of Asia Pacific
7.4.10.1. Rest of Asia Pacific Paper Products Market Size and Forecast, By Product Type (2025-2032)
7.4.10.2. Rest of Asia Pacific Paper Products Market Size and Forecast, By Application(2025-2032)
7.4.10.3. Rest of Asia Pacific Paper Products Market Size and Forecast, By Distribution Channel (2025-2032)
8. Middle East and Africa Paper Products Market Size and Forecast by Segmentation (by Value in USD Million) (2025-2032)
8.1. Middle East and Africa Paper Products Market Size and Forecast, By Product Type (2025-2032)
8.2. Middle East and Africa Paper Products Market Size and Forecast, By Application(2025-2032)
8.3. Middle East and Africa Paper Products Market Size and Forecast, By Distribution Channel (2025-2032)
8.4. Middle East and Africa Paper Products Market Size and Forecast, by Country (2025-2032)
8.4.1. South Africa
8.4.1.1. South Africa Paper Products Market Size and Forecast, By Product Type (2025-2032)
8.4.1.2. South Africa Paper Products Market Size and Forecast, By Application(2025-2032)
8.4.1.3. South Africa Paper Products Market Size and Forecast, By Distribution Channel (2025-2032)
8.4.2. GCC
8.4.2.1. GCC Paper Products Market Size and Forecast, By Product Type (2025-2032)
8.4.2.2. GCC Paper Products Market Size and Forecast, By Application(2025-2032)
8.4.2.3. GCC Paper Products Market Size and Forecast, By Distribution Channel (2025-2032)
8.4.3. Nigeria
8.4.3.1. Nigeria Paper Products Market Size and Forecast, By Product Type (2025-2032)
8.4.3.2. Nigeria Paper Products Market Size and Forecast, By Application(2025-2032)
8.4.3.3. Nigeria Paper Products Market Size and Forecast, By Distribution Channel (2025-2032)
8.4.4. Rest of ME&A
8.4.4.1. Rest of ME&A Paper Products Market Size and Forecast, By Product Type (2025-2032)
8.4.4.2. Rest of ME&A Paper Products Market Size and Forecast, By Application(2025-2032)
8.4.4.3. Rest of ME&A Paper Products Market Size and Forecast, By Distribution Channel (2025-2032)
9. South America Paper Products Market Size and Forecast by Segmentation (by Value in USD Million) (2025-2032)
9.1. South America Paper Products Market Size and Forecast, By Product Type (2025-2032)
9.2. South America Paper Products Market Size and Forecast, By Application(2025-2032)
9.3. South America Paper Products Market Size and Forecast, By Distribution Channel(2025-2032)
9.4. South America Paper Products Market Size and Forecast, by Country (2025-2032)
9.4.1. Brazil
9.4.1.1. Brazil Paper Products Market Size and Forecast, By Product Type (2025-2032)
9.4.1.2. Brazil Paper Products Market Size and Forecast, By Application(2025-2032)
9.4.1.3. Brazil Paper Products Market Size and Forecast, By Distribution Channel (2025-2032)
9.4.2. Argentina
9.4.2.1. Argentina Paper Products Market Size and Forecast, By Product Type (2025-2032)
9.4.2.2. Argentina Paper Products Market Size and Forecast, By Application(2025-2032)
9.4.2.3. Argentina Paper Products Market Size and Forecast, By Distribution Channel (2025-2032)
9.4.3. Rest Of South America
9.4.3.1. Rest Of South America Paper Products Market Size and Forecast, By Product Type (2025-2032)
9.4.3.2. Rest Of South America Paper Products Market Size and Forecast, By Application(2025-2032)
9.4.3.3. Rest Of South America Paper Products Market Size and Forecast, By Distribution Channel (2025-2032)
10. Company Profile: Key Players
10.1. International Paper (Memphis, Tennessee, USA)
10.1.1. Company Overview
10.1.2. Business Portfolio
10.1.3. Financial Overview
10.1.4. SWOT Analysis
10.1.5. Strategic Analysis
10.1.6. Recent Developments
10.2. Georgia-Pacific LLC (Atlanta, Georgia, USA)
10.3. Kimberly-Clark Corporation (Dallas, Texas, USA)
10.4. WestRock Company (Atlanta, Georgia, USA)
10.5. Domtar Corporation (Fort Mill, South Carolina, USA)
10.6. Mondi Group (Vienna, Austria)
10.7. UPM-Kymmene Corporation (Helsinki, Finland)
10.8. Smurfit Kappa Group plc (Dublin, Ireland)
10.9. Stora Enso Oyj (Helsinki, Finland)
10.10. Nine Dragons Paper (Holdings) Limited (Hong Kong)
10.11. Oji Holdings Corporation (Tokyo, Japan)
10.12. Nippon Paper Industries Co., Ltd. (Tokyo, Japan)
10.13. Lee & Man Paper Manufacturing Ltd. (Hong Kong)
10.14. Shandong Sun Paper Industry Joint Stock Co., Ltd. (Yanzhou, China)
10.15. SCA (Stockholm, Sweden)
10.16. Metsä Board Corporation (Espoo, Finland)
10.17. Sappi Limited (Johannesburg, South Africa)
10.18. Rengo Co., Ltd. (Osaka, Japan)
10.19. Hansol Paper Co., Ltd. (Seoul, South Korea)
10.20. Oji Holdings Corporation (Tokyo, Japan)
10.21. Norske Skog (Oslo, Norway)
10.22. Daio Paper Corporation (Tokyo, Japan)
10.23. BillerudKorsnäs AB (Solna, Sweden)
10.24. Packaging Corporation of America (Lake Forest, Illinois, USA)
10.25. Lee & Man Paper Manufacturing Ltd. (Kowloon, Hong Kong)
11. Key Findings
12. Analyst Recommendations
13. Paper Products Market: Research Methodology