Microgrid Market - Global Industry Analysis, Size, Share, Growth, Trend, and Forecast 2026-2034
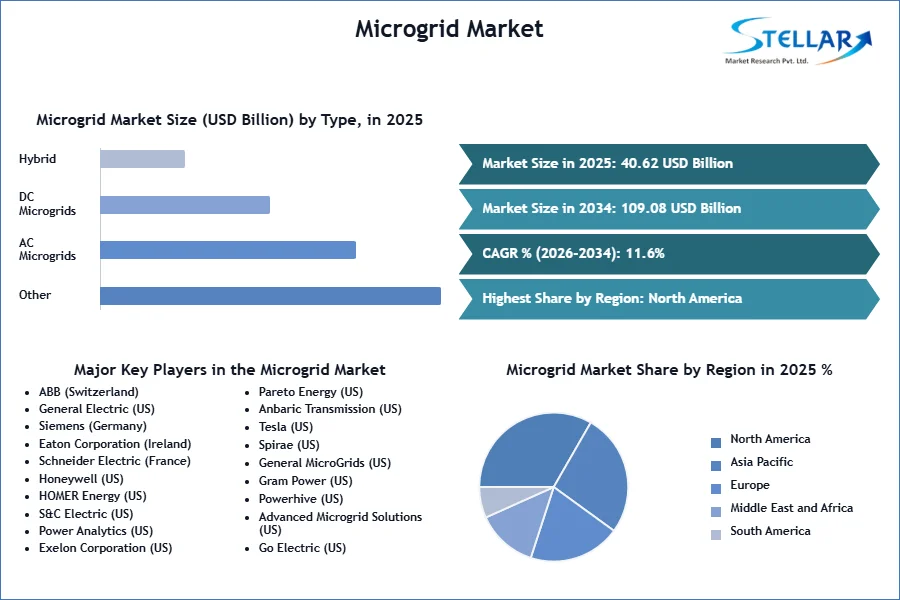
The Microgrid Market size was valued at USD 40.62 Bn. in 2025. The global Microgrid Market is estimated to grow at a CAGR of 11.6% over the forecast period.
Microgrid Market Overview:
A Microgrid is a separate energy system made up of interconnected loads and distributed energy resources that can run in tandem with or independently from the main power grid. Microgrids, in general, are smaller versions of power networks that transport electricity from generators to consumers. They help to lower overall costs and provide grid backup in the event of an outage. Microgrids are more efficient than regular electrical grids and can be integrated with a variety of renewable energy sources such as solar, wind, small hydro, geothermal, waste-to-energy, and combined heat and power (CHP) systems. Batteries, distributed generators, and solar panels can also be used to power them. Microgrids are also a reliable source of electricity because they operate continuously during power outages. The global report on the microgrid Market provides segment analysis and market forecast on the basis of connectivity, type, end-use and region.
To get more Insights: Request Free Sample Report
Microgrid Market Dynamics:
Increasing demand for uninterrupted and reliable power supply
Massive grids were constructed, connecting electricity plants to homes and businesses over thousands of kilometers of cable. Electricity is transmitted across multiple areas and countries from massive, remote power plants that are connected to centralized power systems and use fossil fuels. However, the power plants' limitations in terms of inefficient power transmission have grown more apparent. Traditional systems rely heavily on fossil fuels to generate energy, resulting in pollution and global warming. Natural disasters can potentially pose a threat to these grids, resulting in network outages or blackouts. For example, Hurricane Sandy in the United States and Typhoon Haiyan in the Philippines caused widespread blackouts in major cities such as New York and the islands of Leyte. These communities were without power for several days after the disasters, resulting in a growth in demand for power generating plants or microgrid market.
End users' reliance on utility grids to supply their power demands has increased due to population growth and rising electricity consumption. According to the US Energy Information Administration, global energy consumption is expected to rise by roughly 56% by 2040. In addition, as a result of increased industry and urbanization, energy consumption is increasing at a rapid rate, which is not being met entirely by major networks. These gaps are translating into business possibilities for microgrid market companies looking to expand their power supply services.
According to the EIA, India, and China are undergoing rapid industrial expansion, and by 2040, they will account for half of the world's total increase in energy consumption. Industrial development in these countries, as well as in the United States, is propelling the global energy industry and boosting the microgrid market.
High Initial Investment and Maintenance Cost of Microgrid:
Microgrids have greater initial expenses for construction and maintenance than traditional power grids, ranging from 25% to 30% more. They cover everything from the deployment of communication systems to the installation of smart meters, as well as the ongoing maintenance of the microgrid infrastructure. Smart meter installation prices are 50% higher than electric meter installation expenses. Microgrid distributed energy resources are also more expensive than those employed in classic centralized power plants.
Building a new microgrid or converting an existing system to a hybrid microgrid can cost anywhere from tens of thousands to hundreds of millions of dollars. The generation assets, such as solar PV arrays, batteries, and/or combined heat and power systems, are the most expensive aspect of a microgrid. Investments in grid automation and microgrid controls systems that can intelligently monitor and manage all of the components, managing the way the microgrid consumes and generates energy, would also demand a significant amount of capital. Microgrids are more expensive than regular grids since they can store, convert, and recycle energy, as well as provide superior reliability and power quality. Thus initial investment and mntainace cost hampers growth of the microgrid market.
Microgrid Market Segment Analysis:
By Technology, the Microgrid Market is segmented into Grid Connected and Off-grid Connected. The Grid-connected technology segment dominated the market with 59% in 2025. Multiple generators, distribution networks, and sophisticated controls are all part of a grid-connected microgrid. They provide a variety of advantages, including grid resiliency, higher power quality, and low environmental impact, all of which lead to rising demand. This segment's growth can be ascribed to the global expansion of utility-based grid networks, as well as the large-scale harnessing of renewable energy sources, such as offshore wind.
The Off-grid Connected Technology Segment is expected to grow significantly at a CAGR of 11.4% during the forecast period. The Off-grid power networks are in high demand in many regions of the world, particularly in sectors such as defense, commercial buildings, data centers, and universities. For example, according to the US Department of Energy, the installed capacity of off-grid microgrids was roughly 4225 MW (4.2GW) in 2020. To make the country's energy infrastructure more resilient, the country is planning more off-grid microgrid projects in cities and critical places. As a result, Off-grid microgrids are expected to dominate the microgrid market through the forecast period.
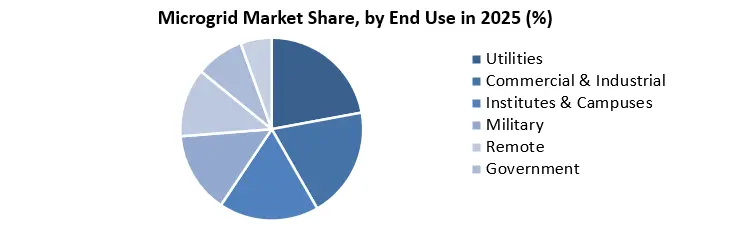
By End-Use, the Microgrid Market is segmented into Utilities, Commercial & Industrial, Institutes & Campuses, Military, Remote, Government, and Healthcare. The Commercial & industrial segment is expected to grow at a CAGR of 10.9% during the forecast period. The constant need for uninterrupted electrical supply to carry out seamless industrial operations to reduce downtime, boost worker productivity, and prevent equipment damages is responsible for the segment's growth. Increased government attempts to promote the use of renewable energy and reduce greenhouse gas (GHG) emissions are also propelling the commercial and industrial microgrid market forward.
Microgrid Market Regional Insights:
The Asia Pacific region dominated the market with a 34% share in 2025. The increased demand for electricity in rural areas of the region is boosting the microgrid market growth. For example, the Rockefeller Foundation has built 160 microgrids in four Indian states, such as Bihar, Uttar Pradesh, Odisha, and Rajasthan. More than 70,000 people in rural areas now have access to energy thanks to the initiative. Many Asian countries have been compelled to look for more microgrid installations as a result of increased power demand and governments' push to integrate renewables into the power generation mix. Even in 2020, India's renewable energy contribution of electricity generation will be around 9.7%, considerably short of the required standards. As a result, several energy businesses are working on microgrid technology project development.
The North America microgrid market is expected to witness significant growth at a CAGR of 11.2% during the forecast period. Canada and the United States are reasonably advanced countries that were among the first in North America to deploy microgrid systems in 2020. These countries' governments have recognized the necessity for a dependable and secure energy source to relieve the strain on traditional power-producing systems. The US market is primarily concerned with grid resiliency and power supply dependability. Other consumer categories are expected to embrace microgrids in the future, significantly driving the market growth.
The objective of the report is to present a comprehensive analysis of the Global Microgrid Market to the stakeholders in the industry. The report provides trends that are most dominant in the Global Microgrid Market and how these trends will influence new business investments and market development throughout the forecast period. The report also aids in the comprehension of the global market dynamics and competitive structure of the market by analyzing market leaders, market followers, and regional players.
The qualitative and quantitative data provided in the Global Microgrid Market report is to help understand which market segments, regions are expected to grow at higher rates, factors affecting the market, and key opportunity areas, which will drive the industry and market growth through the forecast period. The report also includes the competitive landscape of key players in the industry along with their recent developments in the Global Microgrid Market. The report studies factors such as company size, market share, market growth, revenue, production volume, and profits of the key players in the global market
The report provides Porter's Five Force Model, which helps in designing the business strategies in the market. The report helps in identifying how many rivals are existing, who they are, and how their product quality is in the Global Microgrid Market. The report also analyses if the Global Microgrid Market is easy for a new player to gain a foothold in the market, do they enter or exit the market regularly if the market is dominated by a few players, etc.
The report also includes a PESTEL Analysis, which aids in the development of company strategies. Political variables help in figuring out how much a government can influence the Global Microgrid Market. Economic variables aid in the analysis of economic performance drivers that have an impact on the Global Microgrid Market. Understanding the impact of the surrounding environment and the influence of environmental concerns on the global market is aided by legal factors.
Microgrid Market Scope:
|
Microgrid Market |
|
|
Market Size in 2025 |
USD 40.62 Bn. |
|
Market Size in 2034 |
USD 109.08 Bn. |
|
CAGR (2026-2034) |
11.6 % |
|
Historic Data |
2020-2025 |
|
Base Year |
2025 |
|
Forecast Period |
2026-2034 |
|
Segment Scope |
By Connectivity
|
|
By Type
|
|
|
By End-Use
|
|
|
Regional Scope |
North America- United States, Canada, and Mexico Europe – UK, France, Germany, Italy, Spain, Sweden, Austria, and Rest of Europe Asia Pacific – China, India, Japan, South Korea, Australia, ASEAN, Rest of APAC Middle East and Africa - South Africa, GCC, Egypt, Nigeria, Rest of the Middle East and Africa South America – Brazil, Argentina, Rest of South America |
Microgrid Market Key Players:
- ABB (Switzerland)
- General Electric (US)
- Siemens (Germany)
- Eaton Corporation (Ireland)
- Schneider Electric (France)
- Honeywell (US)
- HOMER Energy (US)
- S&C Electric (US)
- Power Analytics (US)
- Exelon Corporation (US)
- Pareto Energy (US)
- Anbaric Transmission (US)
- Tesla (US)
- Spirae (US)
- General MicroGrids (US)
- Gram Power (US)
- Powerhive (US)
- Advanced Microgrid Solutions (US)
- Go Electric (US)
- DAJIE (UK)
- Canopy Power (Singapore)
- Green Energy Corp (US)
- Ferroamp (Sweden)
Frequently Asked Questions
The Asia Pacific region is expected to hold the highest share in the Microgrid Market.
The market size of the Microgrid Market by 2034 is expected to reach at USD 109.08 Bn.
The forecast period for the Microgrid Market is 2026-2034.
The market size of the Microgrid Market in 2025 was valued at USD 40.62 Bn.
Chapter 1 Scope of the Report
Chapter 2 Research Methodology
2.1. Research Process
2.2. Global Microgrid Market: Target Audience
2.3. Global Microgrid Market: Primary Research (As per Client Requirement)
2.4. Global Microgrid Market: Secondary Research
Chapter 3 Executive Summary
Chapter 4 Competitive Landscape
4.1. Market Share Analysis, By Value, 2025-2034
4.1.1. Market Share Analysis, By Region, By Value, 2025-2034 (In %)
4.1.1.1. North America Market Share Analysis, By Value, 2025-2034 (In %)
4.1.1.2. Europe Market Share Analysis, By Value, 2025-2034 (In %)
4.1.1.3. Asia Pacific Market Share Analysis, By Value, 2025-2034 (In %)
4.1.1.4. South America Market Share Analysis, By Value, 2025-2034 (In %)
4.1.1.5. Middle East and Africa Market Share Analysis, By Value, 2025-2034 (In %)
4.1.2. Market Share Analysis, By Connectivity, By Value, 2025-2034 (In %)
4.1.2.1. North America Market Share Analysis, By Connectivity, By Value, 2025-2034 (In %)
4.1.2.1.1. USA Market Share Analysis, By Connectivity, By Value, 2025-2034 (In %)
4.1.2.1.2. Canada Market Share Analysis, By Connectivity, By Value, 2025-2034 (In %)
4.1.2.1.3. Mexico Market Share Analysis, By Connectivity, By Value, 2025-2034 (In %)
4.1.2.2. Europe Market Share Analysis, By Connectivity, By Value, 2025-2034 (In %)
4.1.2.2.1. UK Market Share Analysis, By Connectivity, By Value, 2025-2034 (In %)
4.1.2.2.2. France Market Share Analysis, By Connectivity, By Value, 2025-2034 (In %)
4.1.2.2.3. Germany Market Share Analysis, By Connectivity, By Value, 2025-2034 (In %)
4.1.2.2.4. Italy Market Share Analysis, By Connectivity, By Value, 2025-2034 (In %)
4.1.2.2.5. Spain Market Share Analysis, By Connectivity, By Value, 2025-2034 (In %)
4.1.2.2.6. Sweden Market Share Analysis, By Connectivity, By Value, 2025-2034 (In %)
4.1.2.2.7. Austria Market Share Analysis, By Connectivity, By Value, 2025-2034 (In %)
4.1.2.2.8. Rest of Europe Market Share Analysis, By Connectivity, By Value, 2025-2034 (In %)
4.1.2.3. Asia Pacific Market Share Analysis, By Connectivity, By Value, 2025-2034 (In %)
4.1.2.3.1. China Market Share Analysis, By Connectivity, By Value, 2025-2034 (In %)
4.1.2.3.2. India Market Share Analysis, By Connectivity, By Value, 2025-2034 (In %)
4.1.2.3.3. Japan Market Share Analysis, By Connectivity, By Value, 2025-2034 (In %)
4.1.2.3.4. South Korea Market Share Analysis, By Connectivity, By Value, 2025-2034 (In %)
4.1.2.3.5. Australia Market Share Analysis, By Connectivity, By Value, 2025-2034 (In %)
4.1.2.3.6. ASEAN Market Share Analysis, By Connectivity, By Value, 2025-2034 (In %)
4.1.2.3.7. Rest of APAC Market Share Analysis, By Connectivity, By Value, 2025-2034 (In %)
4.1.2.4. South America Market Share Analysis, By Connectivity, By Value, 2025-2034 (In %)
4.1.2.4.1. Brazil Market Share Analysis, By Connectivity, By Value, 2025-2034 (In %)
4.1.2.4.2. Argentina Market Share Analysis, By Connectivity, By Value, 2025-2034 (In %)
4.1.2.4.3. Rest of South America Market Share Analysis, By Connectivity, By Value, 2025-2034 (In %)
4.1.2.5. Middle East and Africa Market Share Analysis, By Connectivity, By Value, 2025-2034 (In %)
4.1.2.5.1. South Africa Market Share Analysis, By Connectivity, By Value, 2025-2034 (In %)
4.1.2.5.2. GCC Market Share Analysis, By Connectivity, By Value, 2025-2034 (In %)
4.1.2.5.3. Egypt Market Share Analysis, By Connectivity, By Value, 2025-2034 (In %)
4.1.2.5.4. Nigeria Market Share Analysis, By Connectivity, By Value, 2025-2034 (In %)
4.1.2.5.5. Rest of Middle East and Africa Market Share Analysis, By Connectivity, By Value, 2025-2034 (In %)
4.1.3. Market Share Analysis, By Type, By Value, 2025-2034 (In %)
4.1.3.1. North America Market Share Analysis, By Type, By Value, 2025-2034 (In %)
4.1.3.1.1. USA Market Share Analysis, By Type, By Value, 2025-2034 (In %)
4.1.3.1.2. Canada Market Share Analysis, By Type, By Value, 2025-2034 (In %)
4.1.3.1.3. Mexico Market Share Analysis, By Type, By Value, 2025-2034 (In %)
4.1.3.2. Europe Market Share Analysis, By Type, By Value, 2025-2034 (In %)
4.1.3.2.1. UK Market Share Analysis, By Type, By Value, 2025-2034 (In %)
4.1.3.2.2. France Market Share Analysis, By Type, By Value, 2025-2034 (In %)
4.1.3.2.3. Germany Market Share Analysis, By Type, By Value, 2025-2034 (In %)
4.1.3.2.4. Italy Market Share Analysis, By Type, By Value, 2025-2034 (In %)
4.1.3.2.5. Spain Market Share Analysis, By Type, By Value, 2025-2034 (In %)
4.1.3.2.6. Sweden Market Share Analysis, By Type, By Value, 2025-2034 (In %)
4.1.3.2.7. Austria Market Share Analysis, By Type, By Value, 2025-2034 (In %)
4.1.3.2.8. Rest of Europe Market Share Analysis, By Type, By Value, 2025-2034 (In %)
4.1.3.3. Asia Pacific Market Share Analysis, By Type, By Value, 2025-2034 (In %)
4.1.3.3.1. China Market Share Analysis, By Type, By Value, 2025-2034 (In %)
4.1.3.3.2. India Market Share Analysis, By Type, By Value, 2025-2034 (In %)
4.1.3.3.3. Japan Market Share Analysis, By Type, By Value, 2025-2034 (In %)
4.1.3.3.4. South Korea Market Share Analysis, By Type, By Value, 2025-2034 (In %)
4.1.3.3.5. Australia Market Share Analysis, By Type, By Value, 2025-2034 (In %)
4.1.3.3.6. ASEAN Market Share Analysis, By Type, By Value, 2025-2034 (In %)
4.1.3.3.7. Rest of APAC Market Share Analysis, By Type, By Value, 2025-2034 (In %)
4.1.3.4. South America Market Share Analysis, By Type, By Value, 2025-2034 (In %)
4.1.3.4.1. Brazil Market Share Analysis, By Type, By Value, 2025-2034 (In %)
4.1.3.4.2. Argentina Market Share Analysis, By Type, By Value, 2025-2034 (In %)
4.1.3.4.3. Rest of South America Market Share Analysis, By Type, By Value, 2025-2034 (In %)
4.1.3.5. Middle East and Africa Market Share Analysis, By Type, By Value, 2025-2034 (In %)
4.1.3.5.1. South Africa Market Share Analysis, By Type, By Value, 2025-2034 (In %)
4.1.3.5.2. GCC Market Share Analysis, By Type, By Value, 2025-2034 (In %)
4.1.3.5.3. Egypt Market Share Analysis, By Type, By Value, 2025-2034 (In %)
4.1.3.5.4. Nigeria Market Share Analysis, By Type, By Value, 2025-2034 (In %)
4.1.3.5.5. Rest of Middle East and Africa Market Share Analysis, By Type, By Value, 2025-2034 (In %)
4.1.4. Market Share Analysis, By End-Use, By Value, 2025-2034 (In %)
4.1.4.1. North America Market Share Analysis, By End-Use, By Value, 2025-2034 (In %)
4.1.4.1.1. USA Market Share Analysis, By End-Use, By Value, 2025-2034 (In %)
4.1.4.1.2. Canada Market Share Analysis, By End-Use, By Value, 2025-2034 (In %)
4.1.4.1.3. Mexico Market Share Analysis, By End-Use, By Value, 2025-2034 (In %)
4.1.4.2. Europe Market Share Analysis, By End-Use, By Value, 2025-2034 (In %)
4.1.4.2.1. UK Market Share Analysis, By End-Use, By Value, 2025-2034 (In %)
4.1.4.2.2. France Market Share Analysis, By End-Use, By Value, 2025-2034 (In %)
4.1.4.2.3. Germany Market Share Analysis, By End-Use, By Value, 2025-2034 (In %)
4.1.4.2.4. Italy Market Share Analysis, By End-Use, By Value, 2025-2034 (In %)
4.1.4.2.5. Spain Market Share Analysis, By End-Use, By Value, 2025-2034 (In %)
4.1.4.2.6. Sweden Market Share Analysis, By End-Use, By Value, 2025-2034 (In %)
4.1.4.2.7. Austria Market Share Analysis, By End-Use, By Value, 2025-2034 (In %)
4.1.4.2.8. Rest of Europe Market Share Analysis, By End-Use, By Value, 2025-2034 (In %)
4.1.4.3. Asia Pacific Market Share Analysis, By End-Use, By Value, 2025-2034 (In %)
4.1.4.3.1. China Market Share Analysis, By End-Use, By Value, 2025-2034 (In %)
4.1.4.3.2. India Market Share Analysis, By End-Use, By Value, 2025-2034 (In %)
4.1.4.3.3. Japan Market Share Analysis, By End-Use, By Value, 2025-2034 (In %)
4.1.4.3.4. South Korea Market Share Analysis, By End-Use, By Value, 2025-2034 (In %)
4.1.4.3.5. Australia Market Share Analysis, By End-Use, By Value, 2025-2034 (In %)
4.1.4.3.6. ASEAN Market Share Analysis, By End-Use, By Value, 2025-2034 (In %)
4.1.4.3.7. Rest of APAC Market Share Analysis, By End-Use, By Value, 2025-2034 (In %)
4.1.4.4. South America Market Share Analysis, By End-Use, By Value, 2025-2034 (In %)
4.1.4.4.1. Brazil Market Share Analysis, By End-Use, By Value, 2025-2034 (In %)
4.1.4.4.2. Argentina Market Share Analysis, By End-Use, By Value, 2025-2034 (In %)
4.1.4.4.3. Rest of South America Market Share Analysis, By End-Use, By Value, 2025-2034 (In %)
4.1.4.5. Middle East and Africa Market Share Analysis, By End-Use, By Value, 2025-2034 (In %)
4.1.4.5.1. South Africa Market Share Analysis, By End-Use, By Value, 2025-2034 (In %)
4.1.4.5.2. GCC Market Share Analysis, By End-Use, By Value, 2025-2034 (In %)
4.1.4.5.3. Egypt Market Share Analysis, By End-Use, By Value, 2025-2034 (In %)
4.1.4.5.4. Nigeria Market Share Analysis, By End-Use, By Value, 2025-2034 (In %)
4.1.4.5.5. Rest of Middle East and Africa Market Share Analysis, By End-Use, By Value, 2025-2034 (In %)
4.2. Stellar Competition matrix
4.2.1. Global Stellar Competition Matrix
4.2.2. North America Stellar Competition Matrix
4.2.3. Europe Stellar Competition Matrix
4.2.4. Asia Pacific Stellar Competition Matrix
4.2.5. South America Stellar Competition Matrix
4.2.6. Middle East and Africa Stellar Competition Matrix
4.3. Key Players Benchmarking
4.3.1. Key Players Benchmarking By Connectivity, Pricing, Market Share, Investments, Expansion Plans, Physical Presence and Presence in the Market.
4.4. Mergers and Acquisitions in Industry
4.4.1. M&A by Region, Value and Strategic Intent
4.5. Market Dynamics
4.5.1. Market Drivers
4.5.2. Market Restraints
4.5.3. Market Opportunities
4.5.4. Market Challenges
4.5.5. PESTLE Analysis
4.5.6. PORTERS Five Force Analysis
4.5.7. Value Chain Analysis
Chapter 5 Global Microgrid Market Segmentation: By Connectivity
5.1. Global Microgrid Market, By Connectivity, Overview/Analysis, 2025-2034
5.2. Global Microgrid Market, By Connectivity, By Value, Market Share (%), 2025-2034 (USD Million)
5.3. Global Microgrid Market, By Connectivity, By Value, -
5.3.1. Grid Connected
5.3.2. Off-grid Connected
Chapter 6 Global Microgrid Market Segmentation: By Type
6.1. Global Microgrid Market, By Type, Overview/Analysis, 2025-2034
6.2. Global Microgrid Market Size, By Type, By Value, Market Share (%), 2025-2034 (USD Million)
6.3. Global Microgrid Market, By Type, By Value, -
6.3.1. AC Microgrids
6.3.2. DC Microgrids
6.3.3. Hybrid
Chapter 7 Global Microgrid Market Segmentation: By End-Use
7.1. Global Microgrid Market, By End-Use, Overview/Analysis, 2025-2034
7.2. Global Microgrid Market Size, By End-Use, By Value, Market Share (%), 2025-2034 (USD Million)
7.3. Global Microgrid Market, By End-Use, By Value, -
7.3.1. Utilities
7.3.2. Commercial & Industrial
7.3.3. Institutes & Campuses
7.3.4. Military
7.3.5. Remote
7.3.6. Government
7.3.7. Healthcare
Chapter 8 Global Microgrid Market Segmentation: By Region
8.1. Global Microgrid Market, By Region – North America
8.1.1. North America Microgrid Market Size, By Connectivity, By Value, 2025-2034 (USD Million)
8.1.2. North America Microgrid Market Size, By Type, By Value, 2025-2034 (USD Million)
8.1.3. North America Microgrid Market Size, By End-Use, By Value, 2025-2034 (USD Million)
8.1.4. By Country – U.S.
8.1.4.1. U.S. Microgrid Market Size, By Connectivity, By Value, 2025-2034 (USD Million)
8.1.4.2. U.S. Microgrid Market Size, By Type, By Value, 2025-2034 (USD Million)
8.1.4.3. U.S. Microgrid Market Size, By End-Use, By Value, 2025-2034 (USD Million)
8.1.4.4. Canada Microgrid Market Size, By Value, 2025-2034 (USD Million)
8.1.4.5. Mexico Microgrid Market Size, By Value, 2025-2034 (USD Million)
8.2. Europe Microgrid Market Size, By Value, 2025-2034 (USD Million)
8.2.1. UK
8.2.2. France
8.2.3. Germany
8.2.4. Italy
8.2.5. Spain
8.2.6. Sweden
8.2.7. Austria
8.2.8. Rest of Europe
8.3. Asia Pacific Microgrid Market Size, By Value, 2025-2034 (USD Million)
8.3.1. China
8.3.2. India
8.3.3. Japan
8.3.4. South Korea
8.3.5. Australia
8.3.6. ASEAN
8.3.7. Rest of APAC
8.4. Middle East and Africa Microgrid Market Size, By Value, 2025-2034 (USD Million)
8.4.1. South Africa
8.4.2. GCC
8.4.3. Egypt
8.4.4. Nigeria
8.4.5. Rest of Middle East and Africa
8.5. South America Microgrid Market Size, By Value, 2025-2034 (USD Million)
8.5.1. Brazil
8.5.2. Argentina
8.5.3. Rest of South America
Chapter 9 Company Profiles
9.1. Key Players
9.1.1. ABB (Switzerland)
9.1.1.1. Company Overview
9.1.1.2. Tube Portfolio
9.1.1.3. Financial Overview
9.1.1.4. Business Strategy
9.1.1.5. Key Developments
9.1.2. General Electric (US)
9.1.3. Siemens (Germany)
9.1.4. Eaton Corporation (Ireland)
9.1.5. Schneider Electric (France)
9.1.6. Honeywell (US)
9.1.7. HOMER Energy (US)
9.1.8. S&C Electric (US)
9.1.9. Power Analytics (US)
9.1.10. Exelon Corporation (US)
9.1.11. Pareto Energy (US)
9.1.12. Anbaric Transmission (US)
9.1.13. Tesla (US)
9.1.14. Spirae (US)
9.1.15. General MicroGrids (US)
9.1.16. Gram Power (US)
9.1.17. Powerhive (US)
9.1.18. Advanced Microgrid Solutions (US)
9.1.19. Go Electric (US)
9.1.20. DAJIE (UK)
9.1.21. Canopy Power (Singapore)
9.1.22. Green Energy Corp (US)
9.1.23. Ferroamp (Sweden)
9.2. Key Findings
9.3. Recommendations