Laundry Detergent Market 2026–2032 | Liquid Pods, Powder Detergents & Regional Growth
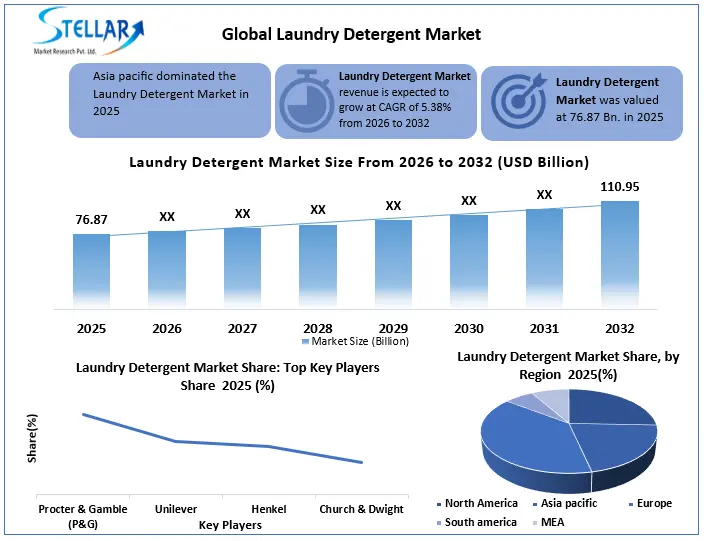
Global Laundry Detergent Market is expected to grow from USD 76.87 billion in 2025 to USD 110.93 billion by 2032, advancing at a 5.38% CAGR. Growth momentum is anchored in rising household wash cycles, scaling commercial laundry infrastructure and accelerating penetration of liquid detergents, pods and sustainable formulations.
Global Laundry Detergent Market Overview:
Global Laundry Detergent Market is undergoing a structural shift, driven by rising hygiene awareness, urban lifestyles and rapid innovation in fabric care formulations. Liquid detergents accounted for XX tons in 2025, while pods, concentrates and eco-friendly formats expect to unlock premium growth upside. With household and commercial laundry fueling volume demand and Asia-Pacific emerging as the fastest growing hub, the laundry detergent market presents attractive opportunities across manufacturing scale-up, premiumization, sustainability innovation and omnichannel expansion by 2032.
For investors and manufacturers, margin expansion is increasingly tied to concentrated formulations, subscription-led e-commerce models and regulatory-aligned green chemistry, positioning innovation-focused brands to outperform in both mature and high growth regions.
Key Highlights (2025)
- Commercial & Institutional Laundry is a Silent Growth Engine:
Beyond household use, laundromats, hospitality, healthcare, and industrial laundry services are scaling rapidly, especially in urban hubs. This B2B segment offers long term contracts, bulk demand and formulation specialization, creating attractive opportunities for manufacturers and distributors.
- Sustainability & Regulatory Tailwinds:
The trend toward phosphate-free and low-impact surfactants supports long-term environmental compliance across Europe and developed markets.
- Innovation-Led Growth:
Advances in enzymatic cleaning, fragrance technology, stain-removal efficiency and AI-enabled smart dosing appliances.
- Asia-Pacific Dominance:
Asia-Pacific dominated with 38.84% of the global laundry detergent market in 2025, driven by rapid urbanization, rising disposable incomes, increasing washing machine penetration and strong demand for premium and eco-friendly formats.
To get more Insights: Request Free Sample Report
Laundry Detergent Market Dynamics:
Strong Shift Toward Liquid & Premium Formats to Boost Laundry Detergent Market Growth
A major growth in driver in laundry detergent market is global consumer preference for liquid detergents and premium formats such as pods and concentrated solutions. In developed regions, liquid detergents dominated over 60% of the laundry detergent market share in 2025, driven by consumer demand for convenience, better solubility and superior stain removal performance.
Premium & Concentrated Detergents to Create Margin Expansion Opportunity:
In Global Laundry Detergent Market, premium liquid detergents, pods and ultra-concentrated formats represent the largest value-creation opportunity. While these products account for less than 40% of total volume, they generate over 55% of total category value in developed markets, supported by superior pricing power, strong brand loyalty and higher repeat purchase behavior.
Laundry Detergent Market Faces Restraint Related to Private Label & Price Pressure
Global Laundry Detergent Market, private-label brands now hold XX% share in Western Europe and XX%+ in North America, pricing 32% below branded products, significantly pressuring margins and brand led growth.
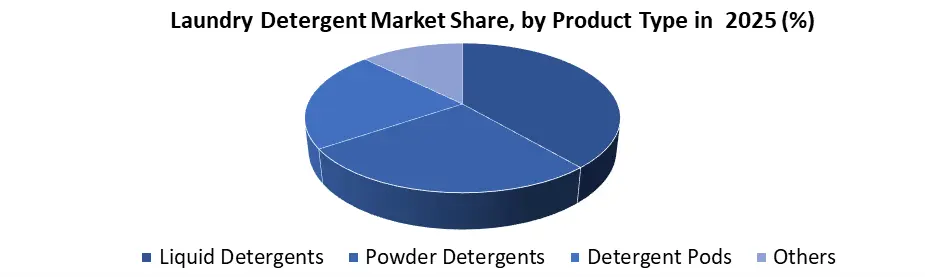
Laundry Detergent Market Segment Analysis by Product Type:
- Liquid detergents dominated global laundry detergent market accounting for 46% of total market value in 2025, driven by superior stain performance, automatic machine compatibility and strong e-commerce penetration, positioning them as the primary growth engine by 2032. Powder detergents continue to anchor demand in price sensitive and high volume washing markets, supported by cost efficiency and bulk usage.
- Detergent pods are emerging as the fastest-growing premium segment, benefiting from convenience, precision dosing and innovation. Meanwhile, specialty formats such as bars and sheets gaining momentum by eco-friendly, low waste positioning.
Laundry Detergent Market Regional Analysis:
Global Liquid Detergent Market show a marked regional divergence, led by Asia-Pacific, which captured 38.84% of global demand in 2025. Growth is fueled by rising urbanization, increased washing machine penetration and expanding middle-class households in China, India and Southeast Asia. North America, held 25.64% market share in 2025, and is expected to remain a high value, innovation-driven market, supported by premium brands, subscription models, and eco-friendly pods. Europe maintained a steady growth (20.90 % share), driven by regulatory compliance, machine compatibility and biodegradable formulations. Emerging markets in South America and MEA are unlocking volume upside by affordable liquids, retail modernization and hygiene conscious consumer adoption.
Laundry Detergent Market Demand & Supply Alignment Analysis:
|
Factor |
Demand Side |
Supply Side |
|
Product Preference |
Liquids & concentrates gaining share |
Capacity expansion in liquid filling lines |
|
Pricing |
Willingness to pay for premium SKUs |
Cost pressure from surfactants & packaging |
|
Sustainability |
Rising eco-conscious consumption |
Shift to biodegradable ingredients & refill packs |
|
Distribution |
E-commerce & modern retail growth |
Omnichannel logistics optimization |
Laundry Detergent Market Competitive Landscape:
Global Laundry Detergent Market is led by multinational leaders such as Procter & Gamble, Unilever, Henkel, Church & Dwight, Kao Corporation and Lion Corporation, who drive innovation, premiumization and sustainability adoption. P&G and Unilever continue to expand digital distribution, subscription models, and eco-friendly liquids and pods. Henkel and Church & Dwight focus on concentrated, hypoallergenic and performance-enhanced solutions. Regional and niche players differentiate through eco-packaging, refill systems and locally tailored formulations, intensifying competition and creating opportunities across household, commercial and industrial laundry segments worldwide.
|
Global Laundry Detergent Market Scope |
|
|
Market Size in 2025 |
USD 76.87 Bn. |
|
Market Size in 2032 |
USD 110.93 Bn. |
|
CAGR (2026-2032) |
5.38% |
|
Historic Data |
2020-2025 |
|
Base Year |
2025 |
|
Forecast Period |
2026-2032 |
|
Segments |
By Product Type Liquid Powder Pods Others |
|
By Application Household Commercial Laundry Industrial Others |
|
|
By Distribution Channel Retail Stores Online Retail Specialty Stores Others |
|
|
Regional Scope |
North America- US, Canada, and Mexico Europe – UK, France, Germany, Italy, Spain, Sweden, Russia, and Rest of Europe Asia Pacific – China, India, Japan, South Korea, Australia, ASEAN, Rest of APAC Middle East and Africa - South Africa, GCC, Egypt, Nigeria, Rest of the Middle East and Africa South America – Brazil, Argentina, Rest of South America |
Key players in Global Laundry Detergent Market:
North America
- Procter & Gamble (USA)
- Church & Dwight (USA)
- The Clorox Company (USA)
- SC Johnson (USA)
- Seventh Generation (USA)
Europe
- Unilever (UK)
- Henkel (Germany)
- Reckitt (UK)
- Ecover (Belgium)
- Werner & Mertz (Germany)
- McBride plc (UK)
Asia–Pacific
- Kao Corporation (Japan)
- Lion Corporation (Japan)
- Nirma Limited (India)
- Godrej Consumer Products (India)
- Dabur (India)
- Blue Moon Group (China)
- Nice Group (China)
- CJ CheilJedang (South Korea)
Middle East & Africa
- Savola Group (Saudi Arabia)
- Hayat Kimya (Turkey)
- Nice Chemicals (South Africa)
South America
- Bombril (Brazil)
- Unilever Andina (Chile)
- Grupo Alicorp (Peru)
Frequently Asked Questions
Asia Pacific region is expected to hold the highest share in the Laundry Detergent Market.
The market size of the Laundry Detergent Market by 2032 is expected to reach USD 110.93 Billion
The forecast period for the Laundry Detergent Market is 2026-2032.
1. Global Laundry Detergent Market Introduction
1.1. Study Assumption and Market Definition
1.2. Scope of the Study
1.3. Executive Summary
2. Global Laundry Detergent Market: Competitive Landscape
2.1. Ecosystem Analysis
2.2. SMR Competition Matrix
2.3. Competitive Landscape
2.4. Key Players Benchmarking
2.4.1. Company Name
2.4.2. Business Segment
2.4.3. End-User Segment
2.4.4. Revenue (2025)
2.4.5. Company Locations
2.5. Market Structure
2.5.1. Market Leaders
2.5.2. Market Followers
2.5.3. Emerging Players
2.6. Mergers and Acquisitions Details
3. Global Laundry Detergent Market: Dynamics
3.1. Global Laundry Detergent Market Trends
3.2. Global Laundry Detergent Market Dynamics
3.2.1. Drivers
3.2.2. Restraints
3.2.3. Opportunities
3.2.4. Challenges
3.3. PORTER’s Five Forces Analysis
3.4. PESTLE Analysis
3.5. Regulatory Landscape by Region
3.6. Key Opinion Leader Analysis for the Global Industry
3.7. Analysis of Government Schemes and Initiatives for Industry
3.8. Technology and Innovation Landscape
3.8.1. Advancements in Detergent Formulations (Enzyme-Based, Low-Foam, Concentrated)
3.8.2. Development of Eco-Friendly and Plant-Based Detergents
3.8.3. Innovations in Fragrance Encapsulation and Fabric Care Technology
3.8.4. Smart Packaging and Dosage Control Solutions
3.8.5. Patent Landscape and R&D Activity in Detergent Chemistry
3.9. Pricing Trend Analysis
3.9.1. Price Trends by Product Type and Region (2020–2025)
(Powder, Liquid, Pods)
3.9.2. Competitive Pricing Strategies of Key Market Players
3.9.3. Impact of Raw Material Costs (Surfactants, Enzymes, Petrochemicals)
3.9.4. Influence of Packaging, Transportation, and Energy Costs
3.10. Application Use Cases and Usage Pattern Trends
3.10.1 Household Laundry Applications (Hand Wash and Machine Wash)
3.10.2. Commercial and Industrial Laundry (Hospitals, Hotels, Laundromats)
3.10.3. Application in Cold Water and Energy-Efficient Washing
3.10.4. Specialized Use Cases (Baby Clothes, Delicates, Sportswear)
3.10.5. Integration with Smart Washing Machines and Auto-Dosing Systems
3.11. Sustainability and Regulatory Landscape
3.11.1. Regulations on Phosphates, Surfactants, and Chemicals
3.11.2. Biodegradable and Zero-Waste Detergent Trends
3.11.3. Sustainable Packaging Initiatives (Refill Packs, Recyclable Bottles)
3.11.4. Corporate ESG and Carbon Footprint Reduction Strategies
3.12. Consumer Behavior and Buying Trends
3.12.1. Shift Toward Premium and Specialized Detergents
3.12.2. Demand for Natural and Skin-Friendly Products
3.12.3. Brand Loyalty vs. Private Label Adoption
3.12.4. Impact of E-Commerce and D2C Channels
4. Global Laundry Detergent Market: Global Market Size and Forecast by Segmentation (by Value in USD Billion and Volume in Tons) (2025-2032)
4.1. Global Laundry Detergent Market Size and Forecast, By Product Type (2025-2032)
4.1.1. Liquid
4.1.2. Powder
4.1.3. Pods
4.1.4. Others
4.2. Global Laundry Detergent Market Size and Forecast, By Application (2025-2032)
4.2.1. Household
4.2.2. Commercial Laundry
4.2.3. Industrial
4.2.4. Others
4.3. Global Laundry Detergent Market Size and Forecast, By Distribution Channel (2025-2032)
4.3.1. Retail Stores
4.3.2. Online Retail
4.3.3. Specialty Stores
4.3.4. Others
4.4. Global Laundry Detergent Market Size and Forecast, by Region (2025-2032)
4.4.1. North America
4.4.2. Europe
4.4.3. Asia Pacific
4.4.4. Middle East and Africa
4.4.5. South America
5. North America Global Laundry Detergent Market Size and Forecast by Segmentation (by Value in USD Billion and Volume in Tons) (2025-2032)
5.1. North America Global Laundry Detergent Market Size and Forecast, By Product Type (2025-2032)
5.1.1. Liquid
5.1.2. Powder
5.1.3. Pods
5.1.4. Others
5.2. Global Laundry Detergent Market Size and Forecast, By Application (2025-2032)
5.2.1. Household
5.2.2. Commercial Laundry
5.2.3. Industrial
5.2.4. Others
5.3. North America Global Laundry Detergent Market Size and Forecast, By Distribution Channel (2024-2032
5.3.1. Retail Stores
5.3.2. Online Retail
5.3.3. Specialty Stores
5.3.4. Others
5.4. North America Global Laundry Detergent Market Size and Forecast, by Country (2025-2032)
5.4.1. United States
5.4.1.1. United States Global Laundry Detergent Market Size and Forecast, By Product Type (2025-2032)
5.4.1.1.1. Liquid
5.4.1.1.2. Powder
5.4.1.1.3. Pods
5.4.1.1.4. Others
5.4.1.2. Global Laundry Detergent Market Size and Forecast, By Application (2025-2032)
5.4.1.2.1. Household
5.4.1.2.2. Commercial Laundry
5.4.1.2.3. Industrial
5.4.1.2.4. Others
5.4.1.3. United States Global Laundry Detergent Market Size and Forecast, By Distribution Channel (2025-2032)
5.4.1.3.1. Retail Stores
5.4.1.3.2. Online Retail
5.4.1.3.3. Specialty Stores
5.4.1.3.4. Others
5.4.2. Canada
1.1.1.1. Canada Global Laundry Detergent Market Size and Forecast, By Product Type (2025-2032)
1.1.1.1.1. Liquid
1.1.1.1.2. Powder
1.1.1.1.3. Pods
1.1.1.1.4. Others
1.1.1.2. Global Laundry Detergent Market Size and Forecast, By Application (2025-2032)
1.1.1.2.1. Household
1.1.1.2.2. Commercial Laundry
1.1.1.2.3. Industrial
1.1.1.2.4. Others
1.1.1.3. Canada Global Laundry Detergent Market Size and Forecast, By Product Type End-User (2025-2032)
1.1.1.3.1. Retail Stores
1.1.1.3.2. Online Retail
1.1.1.3.3. Specialty Stores
1.1.1.3.4. Others
1.1.1. Mexico Global Laundry Detergent Market Size and Forecast, By Product Type (2025-2032)
1.1.1.1.1. Liquid
1.1.1.1.2. Powder
1.1.1.1.3. Pods
1.1.1.1.4. Others
1.1.1.2. Global Laundry Detergent Market Size and Forecast, By Application (2025-2032)
1.1.1.2.1. Household
1.1.1.2.2. Commercial Laundry
1.1.1.2.3. Industrial
1.1.1.2.4. Others
1.1.1.3. Mexico Global Laundry Detergent Market Size and Forecast, By Distribution Channel (2025-2032)
1.1.1.3.1. Retail Stores
1.1.1.3.2. Online Retail
1.1.1.3.3. Specialty Stores
1.1.1.3.4. Others
6. Europe Global Laundry Detergent Market Size and Forecast by Segmentation (by Value in USD Billion and Volume in Tons) (2025-2032)
6.1. Europe Global Laundry Detergent Market Size and Forecast, By Product Type (2025-2032)
6.2. Europe Global Laundry Detergent Market Size and Forecast, By Application (2025-2032)
6.3. Europe Global Laundry Detergent Market Size and Forecast, By Distribution Channel (2025-2032)
6.4. Europe Global Laundry Detergent Market Size and Forecast, by Country (2025-2032)
6.4.1. United Kingdom
6.4.1.1. United Kingdom Global Laundry Detergent Market Size and Forecast, By Product Type (2025-2032)
6.4.1.2. United Kingdom Global Laundry Detergent Market Size and Forecast, By Application (2025-2032)
6.4.1.3. United Kingdom Global Laundry Detergent Market Size and Forecast, By Distribution Channel (2025-2032)
6.4.2. France
6.4.2.1. France Global Laundry Detergent Market Size and Forecast, By Product Type (2025-2032)
6.4.2.2. France Global Laundry Detergent Market Size and Forecast, By Application (2025-2032)
6.4.2.3. France Global Laundry Detergent Market Size and Forecast, By Distribution Channel (2025-2032)
6.4.3. Germany
6.4.3.1. Germany Global Laundry Detergent Market Size and Forecast, By Product Type (2025-2032)
6.4.3.2. Germany Global Laundry Detergent Market Size and Forecast, By Application (2025-2032)
6.4.3.3. Germany Global Laundry Detergent Market Size and Forecast, By Distribution Channel (2025-2032)
6.4.4. Italy
6.4.4.1. Italy Global Laundry Detergent Market Size and Forecast, By Product Type (2025-2032)
6.4.4.2. Italy Global Laundry Detergent Market Size and Forecast, By Application (2025-2032)
6.4.4.3. Italy Global Laundry Detergent Market Size and Forecast, By Distribution Channel (2025-2032)
6.4.5. Spain
6.4.5.1. Spain Global Laundry Detergent Market Size and Forecast, By Product Type (2025-2032)
6.4.5.2. Spain Global Laundry Detergent Market Size and Forecast, By Application (2025-2032)
6.4.5.3. Spain Global Laundry Detergent Market Size and Forecast, By Distribution Channel (2025-2032)
6.4.6. Sweden
6.4.6.1. Sweden Global Laundry Detergent Market Size and Forecast, By Product Type (2025-2032)
6.4.6.2. Sweden Global Laundry Detergent Market Size and Forecast, By Application (2025-2032)
6.4.6.3. Sweden Global Laundry Detergent Market Size and Forecast, By Distribution Channel (2025-2032)
6.4.7. Austria
6.4.7.1. Austria Global Laundry Detergent Market Size and Forecast, By Product Type (2025-2032)
6.4.7.2. Austria Global Laundry Detergent Market Size and Forecast, By Application (2025-2032)
6.4.7.3. Austria Global Laundry Detergent Market Size and Forecast, By Distribution Channel (2025-2032)
6.4.8. Rest of Europe
6.4.8.1. Rest of Europe Global Laundry Detergent Market Size and Forecast, By Product Type (2025-2032)
6.4.8.2. Rest of Europe Global Laundry Detergent Market Size and Forecast, By Application (2025-2032)
6.4.8.3. Rest of Europe Global Laundry Detergent Market Size and Forecast, By Distribution Channel (2025-2032)
7. Asia Pacific Global Laundry Detergent Market Size and Forecast by Segmentation (by Value in USD Billion and Volume in Tons) (2025-2032)
7.1. Asia Pacific Global Laundry Detergent Market Size and Forecast, By Product Type (2025-2032)
7.2. Asia Pacific Global Laundry Detergent Market Size and Forecast, By Application (2025-2032)
7.3. Asia Pacific Global Laundry Detergent Market Size and Forecast, By Distribution Channel (2025-2032)
7.4. Asia Pacific Global Laundry Detergent Market Size and Forecast, by Country (2025-2032)
7.4.1. China
7.4.1.1. China Global Laundry Detergent Market Size and Forecast, By Product Type (2025-2032)
7.4.1.2. China Global Laundry Detergent Market Size and Forecast, By Application (2025-2032)
7.4.1.3. China Global Laundry Detergent Market Size and Forecast, By Distribution Channel (2025-2032)
7.4.2. S Korea
7.4.2.1. S Korea Global Laundry Detergent Market Size and Forecast, By Product Type (2025-2032)
7.4.2.2. S Korea Global Laundry Detergent Market Size and Forecast, By Application (2025-2032)
7.4.2.3. S Korea Global Laundry Detergent Market Size and Forecast, By Distribution Channel (2025-2032)
7.4.3. Japan
7.4.3.1. Japan Global Laundry Detergent Market Size and Forecast, By Product Type (2025-2032)
7.4.3.2. Japan Global Laundry Detergent Market Size and Forecast, By Application (2025-2032)
7.4.3.3. Japan Global Laundry Detergent Market Size and Forecast, By Distribution Channel (2025-2032)
7.4.4. India
7.4.4.1. India Global Laundry Detergent Market Size and Forecast, By Product Type (2025-2032)
7.4.4.2. India Global Laundry Detergent Market Size and Forecast, By Application (2025-2032)
7.4.4.3. India Global Laundry Detergent Market Size and Forecast, By Distribution Channel (2025-2032)
7.4.5. Australia
7.4.5.1. Australia Global Laundry Detergent Market Size and Forecast, By Product Type (2025-2032)
7.4.5.2. Australia Global Laundry Detergent Market Size and Forecast, By Application (2025-2032)
7.4.5.3. Australia Global Laundry Detergent Market Size and Forecast, By Distribution Channel (2025-2032)
7.4.6. Indonesia
7.4.6.1. Indonesia Global Laundry Detergent Market Size and Forecast, By Product Type (2025-2032)
7.4.6.2. Indonesia Global Laundry Detergent Market Size and Forecast, By Application (2025-2032)
7.4.6.3. Indonesia Global Laundry Detergent Market Size and Forecast, By Distribution Channel (2025-2032)
7.4.7. Malaysia
7.4.7.1. Malaysia Global Laundry Detergent Market Size and Forecast, By Product Type (2025-2032)
7.4.7.2. Malaysia Global Laundry Detergent Market Size and Forecast, By Application (2025-2032)
7.4.7.3. Malaysia Global Laundry Detergent Market Size and Forecast, By Distribution Channel (2025-2032)
7.4.8. Vietnam
7.4.8.1. Vietnam Global Laundry Detergent Market Size and Forecast, By Product Type (2025-2032)
7.4.8.2. Vietnam Global Laundry Detergent Market Size and Forecast, By Application (2025-2032)
7.4.8.3. Vietnam Global Laundry Detergent Market Size and Forecast, By Distribution Channel (2025-2032)
7.4.9. Philippines
7.4.9.1. Philippines Global Laundry Detergent Market Size and Forecast, By Product Type (2025-2032)
7.4.9.2. Philippines Global Laundry Detergent Market Size and Forecast, By Application (2025-2032)
7.4.9.3. Philippines Global Laundry Detergent Market Size and Forecast, By Distribution Channel (2025-2032)
7.4.10. ASEAN
7.4.10.1. ASEAN Global Laundry Detergent Market Size and Forecast, By Product Type (2025-2032)
7.4.10.2. ASEAN Global Laundry Detergent Market Size and Forecast, By Application (2025-2032)
7.4.10.3. ASEAN Global Laundry Detergent Market Size and Forecast, By Distribution Channel (2025-2032)
7.4.11. Rest of Asia Pacific
7.4.11.1. Rest of Asia Pacific Global Laundry Detergent Market Size and Forecast, By Product Type (2025-2032)
7.4.11.2. Rest of Asia Pacific Global Laundry Detergent Market Size and Forecast, By Application (2025-2032)
7.4.11.3. Rest of Asia Pacific Global Laundry Detergent Market Size and Forecast, By Distribution Channel (2025-2032)
8. Middle East and Africa Global Laundry Detergent Market Size and Forecast by Segmentation (by Value in USD Billion and Volume in Tons) (2025-2032)
8.1. Middle East and Africa Global Laundry Detergent Market Size and Forecast, By Product Type (2025-2032)
8.2. Middle East and Africa Global Laundry Detergent Market Size and Forecast, By Application (2025-2032)
8.3. Middle East and Africa Global Laundry Detergent Market Size and Forecast, By Distribution Channel (2025-2032)
8.4. Middle East and Africa Global Laundry Detergent Market Size and Forecast, by Country (2025-2032)
8.4.1. South Africa
8.4.1.1. South Africa Global Laundry Detergent Market Size and Forecast, By Product Type (2025-2032)
8.4.1.2. South Africa Global Laundry Detergent Market Size and Forecast, By Application (2025-2032)
8.4.1.3. South Africa Global Laundry Detergent Market Size and Forecast, By Distribution Channel (2025-2032)
8.4.2. GCC
8.4.2.1. GCC Global Laundry Detergent Market Size and Forecast, By Product Type (2025-2032)
8.4.2.2. GCC Global Laundry Detergent Market Size and Forecast, By Application (2025-2032)
8.4.2.3. GCC Global Laundry Detergent Market Size and Forecast, By Distribution Channel (2025-2032)
8.4.3. Nigeria
8.4.3.1. Nigeria Global Laundry Detergent Market Size and Forecast, By Product Type (2025-2032)
8.4.3.2. Nigeria Global Laundry Detergent Market Size and Forecast, By Application (2025-2032)
8.4.3.3. Nigeria Global Laundry Detergent Market Size and Forecast, By Distribution Channel (2025-2032)
8.4.4. Rest of ME&A
8.4.4.1. Rest of ME&A Global Laundry Detergent Market Size and Forecast, By Product Type (2025-2032)
8.4.4.2. Rest of ME&A Global Laundry Detergent Market Size and Forecast, By Application (2025-2032)
8.4.4.3. Rest of ME&A Global Laundry Detergent Market Size and Forecast, By Distribution Channel (2025-2032)
9. South America Global Laundry Detergent Market Size and Forecast by Segmentation (by Value in USD Billion and Volume in Tons) (2025-2032)
9.1. South America Global Laundry Detergent Market Size and Forecast, By Product Type (2025-2032)
9.2. South America Global Laundry Detergent Market Size and Forecast, By Application (2025-2032)
9.3. South America Global Laundry Detergent Market Size and Forecast, By Distribution Channel (2025-2032)
9.4. South America Global Laundry Detergent Market Size and Forecast, by Country (2025-2032)
9.4.1. Brazil
9.4.1.1. Brazil Global Laundry Detergent Market Size and Forecast, By Product Type (2025-2032)
9.4.1.2. Brazil Global Laundry Detergent Market Size and Forecast, By Application (2025-2032)
9.4.1.3. Brazil Global Laundry Detergent Market Size and Forecast, By Distribution Channel (2025-2032)
9.4.2. Argentina
9.4.2.1. Argentina Global Laundry Detergent Market Size and Forecast, By Product Type (2025-2032)
9.4.2.2. Argentina Global Laundry Detergent Market Size and Forecast, By Application (2025-2032)
9.4.2.3. Argentina Global Laundry Detergent Market Size and Forecast, By Distribution Channel (2025-2032)
9.4.3. Rest Of South America
9.4.3.1. Rest Of South America Global Laundry Detergent Market Size and Forecast, By Product Type (2025-2032)
9.4.3.2. Rest Of South America Global Laundry Detergent Market Size and Forecast, By Application (2025-2032)
9.4.3.3. Rest Of South America Global Laundry Detergent Market Size and Forecast, By Distribution Channel (2025-2032)
10. Company Profile: Key Players
10.1. Procter & Gamble (USA)
10.1.1. Company Overview
10.1.2. Business Portfolio
10.1.3. Financial Overview
10.1.4. SWOT Analysis
10.1.5. Strategic Analysis
10.1.6. Recent Developments
10.2. Church & Dwight (USA)
10.3. The Clorox Company (USA)
10.4. SC Johnson (USA)
10.5. Seventh Generation (USA)
10.6. Unilever (UK)
10.7. Henkel (Germany)
10.8. Reckitt (UK)
10.9. Ecover (Belgium)
10.10. Werner & Mertz (Germany)
10.11. McBride plc (UK)
10.12. Kao Corporation (Japan)
10.13. Lion Corporation (Japan)
10.14. Nirma Limited (India)
10.15. Godrej Consumer Products (India)
10.16. Dabur (India)
10.17. Blue Moon Group (China)
10.18. Nice Group (China)
10.19. CJ CheilJedang (South Korea)
10.20. Savola Group (Saudi Arabia)
10.21. Hayat Kimya (Turkey)
10.22. Nice Chemicals (South Africa)
10.23. Bombril (Brazil)
10.24. Unilever Andina (Chile)
10.25. Grupo Alicorp (Peru)
11. Key Findings
12. Analyst Recommendations
13. Global Laundry Detergent Market: Research Methodology