Energy as a Service Market - Global Industry Analysis, Size, Share, Growth, Trend and Forecast 2026-2034
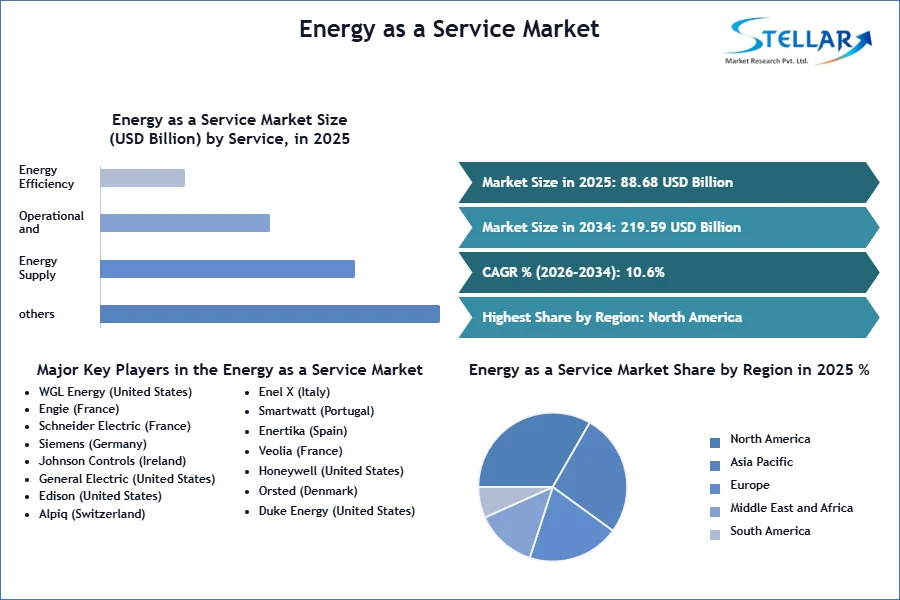
The Energy as a Service Market size was valued at USD 88.68 Bn. in 2025. Global Energy as a Service Market is estimated to grow at a CAGR of 10.6% over the forecast period.
Energy as a Service Market Overview:
Energy as a Service (EaaS) has aided in raising awareness of the importance of better energy management. Energy as a service is a fast expanding business model that offers a variety of energy-related services and optimization solutions to small, medium, and big organizations. In the electricity industry, service business models, often known as energy-as-a-service, offer customers energy services like illumination in exchange for a monthly cost. The consumer saves money by eliminating direct electricity bills, costly electrical equipment or software upgrades, and device management while still getting the most out of the device. EaaS, like other service models, can make superior technology (such as energy devices and software) more available, benefiting consumers, service firms, the electrical grid, and possibly society as a whole. Energy as a Service Market report comes with the PORTER analysis PESTLE analysis, Segment analysis on the basis of service type, end user and region along with market forecast size for each segment.
Energy as a Service (EAAS) is a new idea that is now in its infancy in developing countries. It entails the administration of various energy portfolios, energy supply, energy use, program management, asset management, and other activities. The energy as a service market has the potential to reach a wide range of consumers and fuel and power its development across all industries. To attract more clients, most energy and service providers are cooperating with third-party vendors and prospective business disruptors. Many governments, across the globe, are formulating and implementing regulatory strategies to increase the pace of EAAS adoption.
To get more Insights: Request Free Sample Report
Energy as a Service Market Dynamics:
Growing Energy Demand and Consumption across the Globe:
The growing energy demand is driving the energy as a service market, with the goal of lowering building energy costs and carbon emissions. Market growth is fueled by a number of factors, including increasing distributed energy resources, cheaper renewable energy generation prices, and storage alternatives. Energy consumption is expected to increase across the globe, which would be beneficial to the market growth. According to the US Energy Information Administration, global energy consumption is expected to rise by nearly 50% between 2020 and 2050. The industrial sector utilizes the most energy of any end-use sector, including refineries, mining, manufacturing, agriculture, and construction.
The Evolution of the Power Grid System:
Generally, power has been generated centrally by highly regulated vertically integrated utilities whose major goal has been to deliver safe, affordable, and reliable electricity. The majority of the energy came from fossil fuels like coal and gas, although there was also a hydro and nuclear power. The flow has been one-way, with passive ratepayers receiving it via transmission and distribution networks. However, as the grid becomes ‘smart,' there are likely to be more changes in the next ten years than there have been in the previous 100. Thanks to enhanced communication and digital technologies, distribution points, traditional power generation, and renewable generation all will be integrated into a system with a high level of automation and a two-way flow of electricity and information. As a result, changes in the grid's operation are expected to pave the path for the emergence of new and quite diverse business opportunities in the Energy as a Service Market.
Growing Energy Efficiency:
Smart technology-based energy efficiency programs offer a substantial opportunity for reaching decarbonization goals. One of the primary policy pillars in the European Union's fourth energy package, which was launched in 2025, is energy efficiency. Buildings account for 40% of final energy consumption and 36% of greenhouse gas emissions in Europe, thus improving their energy efficiency is a top priority. Buildings will have to reduce their energy consumption by 75% to satisfy the Paris Agreement targets. In comparison to assets such as vehicles and factories, building digitization is still in its early stages, but it is expected to increase rapidly. The market for Internet of Things-connected goods for smart buildings and homes is expected to reach $100 billion in the future. As a result, these factors are expected to boost the energy as a service market growth throughout the forecast period.

Energy as a Service Market Segment Analysis:
By Service Type, the Energy as a Service Market is segmented into Energy Supply Services, Operational and Maintenance Services, and Energy Efficiency and Optimization Services. The Energy Supply Services segment has dominated the market with a 39.6% share in 2025. The rising energy rates lead to consumers seeking a reliable energy supply to ensure that they can run without relying on the grid. With a growing focus on various energy supply sources such as renewable, fossil fuels, nuclear, biomass, and biofuels, the energy as a service model primarily supports renewable energy as it ensures high energy efficiency, reduces carbon emissions, lowers energy costs, and is environmentally friendly. It provides customers with more options regarding ownership, pricing, and financing. It also assists operators in customizing energy generation solutions that are current and robust based on consumer requirements. It makes the integration of distributed generation and energy storage assets simple and quick.
By End-User, the Energy as a Service Market is segmented into commercial and Industrial. The Commercial segment has dominated the market with a 64.2% share in 2025. Data centers, recreational centers, healthcare, educational institutions, airports, warehouses, hotels, and other commercial establishments make up the commercial section. The commercial section covers energy or power conservation services supplied by an Energy as a Service (EaaS) provider for different applications. The EaaS company provides a variety of technological and software solutions for analyzing electricity use patterns.
Energy is utilized in a variety of ways, but one of the most major uses of energy is in the commercial sector, which uses a lot of it to run district heating facilities and electrical applications. The adoption of EaaS by the commercial sector is expected to reduce fossil-fuel-based power usage, assisting in meeting emission targets necessary to avert severe climate change. In addition, with an ever-increasing population, energy conservation is critical to ensuring the country's long-term viability. With government backing, private entities are focusing on the commercial segment that is expected to grow their services during the forecast period.
Energy as a Service Market Regional Insights:
The North American region dominated the Energy as a Service Market with a 45.2% share in 2025. North America is one of the most well-known regions to have adopted EaaS in a variety of industries. The region has implemented a number of projects, particularly in the commercial sector, that are projected to improve energy efficiency and save operating costs. To achieve energy efficiency, the United States has used a pay-for-performance system. It is expected that the method can help to reduce energy use by about 15%. As a result of this strategy throughout the country, many energy or utility companies have been able to extend a service line that can give services to save electricity. For example, in California, energy efficiency rules require that at least 60% of the savings realized through obligation schemes be delivered by third-party service providers.
In order to achieve maximum energy efficiency in the business sector, the regional countries are also exploring novel measures such as pay-for-performance. In the future, the energy as a service market in this region is expected to be driven by an increase in the percentage of renewable power generation and energy efficiency initiatives.
The Asia Pacific region is expected to grow at a significant rate with a CAGR of 10.6% during the forecast period. The region's growth is attributed to the existence of major market players in countries like India and China, as well as a large customer base, the entire energy as a service market in the Asia Pacific. In addition, energy as a service is gaining traction as a result of increased transformation in the energy industry, such as digitization, decarbonization, and rapid development in distribution generation services, which is expected to drive EAAS market growth throughout the forecast period.
The objective of the report is to present a comprehensive analysis of the Global Energy as a Service Market to the stakeholders in the industry. The report provides trends that are most dominant in the Global Energy as a Service Market and how these trends will influence new business investments and market development throughout the forecast period. The report also aids in the comprehension of the global market dynamics and competitive structure of the market by analyzing market leaders, market followers, and regional players.
The qualitative and quantitative data provided in the Global Energy as a Service Market report is to help understand which market segments, regions are expected to grow at higher rates, factors affecting the market, and key opportunity areas, which will drive the industry and market growth through the forecast period. The report also includes the competitive landscape of key players in the industry along with their recent developments in the global market. The report studies factors such as company size, market share, market growth, revenue, production volume, and profits of the key players in the global market.
The report provides Porter's Five Force Model, which helps in designing the business strategies in the market. The report helps in identifying how many rivals are existing, who they are, and how their product quality is in the Global Energy as a Service Market. The report also analyses if the Global Energy as a Service Market is easy for a new player to gain a foothold in the market, do they enter or exit the market regularly if the market is dominated by a few players, etc.
The report also includes a PESTEL Analysis, which aids in the development of company strategies. Political variables help in figuring out how much a government can influence the Global Energy as a Service Market. Economic variables aid in the analysis of economic performance drivers that have an impact on the Global Energy as a Service Market. Understanding the impact of the surrounding environment and the influence of environmental concerns on the Global Energy as a Service Market is aided by legal factors.
Energy as a Service Market Scope:
|
Energy as a Service Market |
|
|
Market Size in 2025 |
USD 88.68 Bn. |
|
Market Size in 2035 |
USD 219.59 Bn. |
|
CAGR (2026-2034) |
10.6% |
|
Historic Data |
2020-2025 |
|
Base Year |
2025 |
|
Forecast Period |
2026-2034 |
|
Segment Scope |
By Service Type
|
|
by End-User
|
|
|
Regional Scope |
North America- United States, Canada, and Mexico Europe – UK, France, Germany, Italy, Spain, Sweden, Austria, and Rest of Europe Asia Pacific – China, India, Japan, South Korea, Australia, ASEAN, Rest of APAC Middle East and Africa - South Africa, GCC, Egypt, Nigeria, Rest of the Middle East and Africa South America – Brazil, Argentina, Rest of South America |
Energy as a Service Market Key Players:
- WGL Energy (United States)
- Engie (France)
- Schneider Electric (France)
- Siemens (Germany)
- Johnson Controls (Ireland)
- General Electric (United States)
- Edison (United States)
- Alpiq (Switzerland)
- Enel X (Italy)
- Smartwatt (Portugal)
- Enertika (Spain)
- Veolia (France)
- Honeywell (United States)
- Orsted (Denmark)
- Duke Energy (United States)
- Contemporary Energy Solutions (United States)
- Solarus Sunpower B.V. (Netherlands)
Frequently Asked Questions
The North America region is expected to hold the highest share in the Energy as a Service Market.
The market size of the Energy as a Service Market by 2034 is expected to reach at USD 219.59 Bn.
The forecast period for the Energy as a Service Market is 2026-2034.
The market size of the Energy as a Service Market in 2025 was valued at USD 88.68 Bn.
1. Research Methodology
1.1 Research Data
1.1.1. Primary Data
1.1.2. Secondary Data
1.2. Market Size Estimation
1.2.1. Bottom-Up Approach
1.2.2. Top-Down Approach
1.3. Market Breakdown and Data Triangulation
1.4. Research Assumption
2. Energy as a Service Market Executive Summary
2.1. Market Overview
2.2. Market Size (2024) and Forecast (2025-2032) and Y-O-Y%
2.3. Market Size (USD) and Market Share (%) – By Segments and Regions
3. Global Energy as a Service Market: Competitive Landscape
3.1. SMR Competition Matrix
3.2. Key Players Benchmarking
3.2.1. Company Name
3.2.2. Headquarter
3.2.3. Business Segment
3.2.4. End-user Segment
3.2.5. Y-O-Y%
3.2.6. Revenue (2024)
3.2.7. Profit Margin
3.2.8. Market Share
3.2.9. Company Locations
3.3. Market Structure
3.3.1. Market Leaders
3.3.2. Market Followers
3.3.3. Emerging Players
3.4. Consolidation of the Market
3.4.1. Strategic Initiatives
3.4.2. Mergers and Acquisitions
3.4.3. Collaborations and Partnerships
3.4.4. Developments and Innovations
4. Energy as a Service Market: Dynamics
4.1. Energy as a Service Market Trends by Region
4.1.1. North America
4.1.2. Europe
4.1.3. Asia Pacific
4.1.4. Middle East and Africa
4.1.5. South America
4.2. Energy as a Service Market Drivers
4.3. Energy as a Service Market Restraints
4.4. Energy as a Service Market Opportunities
4.5. Energy as a Service Market Challenges
4.6. PORTER’s Five Forces Analysis
4.6.1. Intensity of the Rivalry
4.6.2. Threat of New Entrants
4.6.3. Bargaining Power of Suppliers
4.6.4. Bargaining Power of Buyers
4.6.5. Threat of Substitutes
4.7. PESTLE Analysis
4.7.1. Political Factors
4.7.2. Economic Factors
4.7.3. Social Factors
4.7.4. Technological Factors
4.7.5. Legal Factors
4.7.6. Environmental Factors
4.8. Technological Roadmap
4.9. Regulatory Landscape
4.9.1. Market Regulation by Region
4.9.1.1. North America
4.9.1.2. Europe
4.9.1.3. Asia Pacific
4.9.1.4. Middle East and Africa
4.9.1.5. South America
4.9.2. Impact of Regulations on Market Dynamics
4.9.3. Government Schemes and Initiatives
5. Global Energy as a Service Market: Global Market Size and Forecast by Segmentation (by Value in USD Million) (2024-2032)
5.1. Global Energy as a Service Market Size and Forecast, by Service Type (2024-2032)
5.1.1. Energy Supply Services
5.1.2. Operational and Maintenance Services
5.1.3. Energy Efficiency and Optimization Services
5.2. Global Energy as a Service Market Size and Forecast, by End User (2024-2032)
5.2.1. Commercial
5.2.2. Industrial
5.3. Global Energy as a Service Market Size and Forecast, by Region (2024-2032)
5.3.1. North America
5.3.2. Europe
5.3.3. Asia Pacific
5.3.4. Middle East and Africa
5.3.5. South America
6. North America Energy as a Service Market Size and Forecast by Segmentation (by Value in USD Million) (2024-2032)
6.1. North America Energy as a Service Market Size and Forecast, by Service Type (2024-2032)
6.1.1. Energy Supply Services
6.1.2. Operational and Maintenance Services
6.1.3. Energy Efficiency and Optimization Services
6.2. North America Energy as a Service Market Size and Forecast, by End User (2024-2032)
6.2.1. Commercial
6.2.2. Industrial
6.3. North America Energy as a Service Market Size and Forecast, by Country (2024-2032)
6.3.1. United States
6.3.2. Canada
6.3.3. Mexico
7. Europe Energy as a Service Market Size and Forecast by Segmentation (by Value in USD Million) (2024-2032)
7.1. Europe Energy as a Service Market Size and Forecast, by Service Type (2024-2032)
7.2. Europe Energy as a Service Market Size and Forecast, by End User (2024-2032)
7.3. Europe Energy as a Service Market Size and Forecast, by Country (2024-2032)
7.3.1. United Kingdom
7.3.2. France
7.3.3. Germany
7.3.4. Italy
7.3.5. Spain
7.3.6. Sweden
7.3.7. Austria
7.3.8. Rest of Europe
8. Asia Pacific Energy as a Service Market Size and Forecast by Segmentation (by Value in USD Million) (2024-2032)
8.1. Asia Pacific Energy as a Service Market Size and Forecast, by Service Type (2024-2032)
8.2. Asia Pacific Energy as a Service Market Size and Forecast, by End User (2024-2032)
8.3. Asia Pacific Energy as a Service Market Size and Forecast, by Country (2024-2032)
8.3.1. China
8.3.2. S Korea
8.3.3. Japan
8.3.4. India
8.3.5. Australia
8.3.6. Indonesia
8.3.7. Malaysia
8.3.8. Vietnam
8.3.9. Taiwan
8.3.10. Rest of Asia Pacific
9. Middle East and Africa Energy as a Service Market Size and Forecast by Segmentation (by Value in USD Million) (2024-2032)
9.1. Middle East and Africa Energy as a Service Market Size and Forecast, by Service Type (2024-2032)
9.2. Middle East and Africa Energy as a Service Market Size and Forecast, by End User (2024-2032)
9.3. Middle East and Africa Energy as a Service Market Size and Forecast, by Country (2024-2032)
9.3.1. South Africa
9.3.2. GCC
9.3.3. Nigeria
9.3.4. Rest of ME&A
10. South America Energy as a Service Market Size and Forecast by Segmentation (by Value in USD Million) (2024-2032)
10.1. South America Energy as a Service Market Size and Forecast, by Service Type (2024-2032)
10.2. South America Energy as a Service Market Size and Forecast, by End User (2024-2032)
10.3. South America Energy as a Service Market Size and Forecast, by Country (2024-2032)
10.3.1. Brazil
10.3.2. Argentina
10.3.3. Rest Of South America
11. Company Profile: Key Players
11.1. WGL Energy (United States)
11.1.1. Company Overview
11.1.2. Business Portfolio
11.1.3. Financial Overview
11.1.3.1. Total Revenue
11.1.3.2. Segment Revenue
11.1.3.3. Regional Revenue
11.1.4. SWOT Analysis
11.1.5. Strategic Analysis
11.1.6. Recent Developments
11.2. Engie (France)
11.3. Schneider Electric (France)
11.4. Siemens (Germany)
11.5. Johnson Controls (Ireland)
11.6. General Electric (United States)
11.7. Edison (United States)
11.8. Alpiq (Switzerland)
11.9. Enel X (Italy)
11.10. Smartwatt (Portugal)
11.11. Enertika (Spain)
11.12. Veolia (France)
11.13. Honeywell (United States)
11.14. Orsted (Denmark)
11.15. Duke Energy (United States)
11.16. Contemporary Energy Solutions (United States)
11.17. Solarus Sunpower B.V. (Netherlands)
12. Key Findings
13. Analyst Recommendations
13.1. Strategic Recommendations
13.2. Future Outlook