Dry Shampoo Market - Global Market Outlook and Forecast (2026-2032) Trends, Statistics, Dynamics, Segmentation by Form, End User, Distribution Channel, and Region
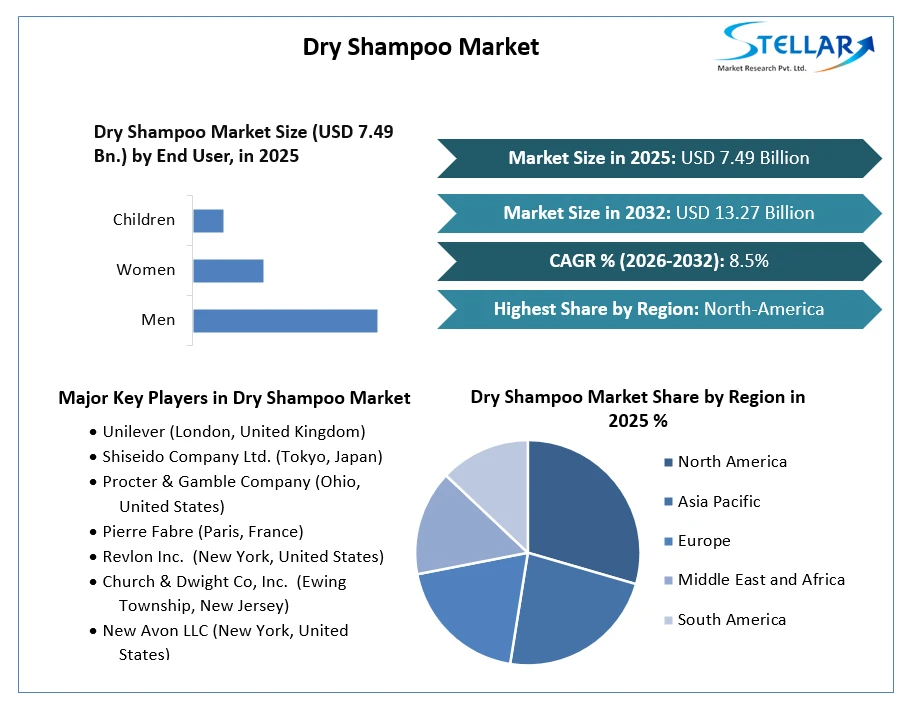
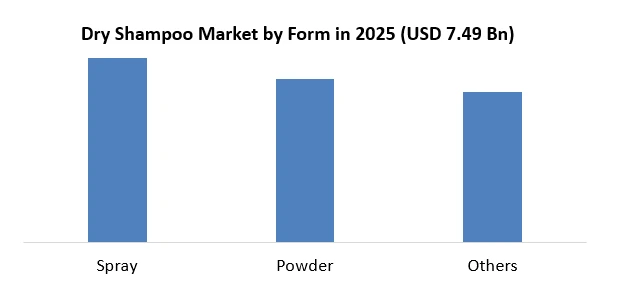
Dry Shampoo Market was valued at USD 7.49 billion in 2025. Global Dry Shampoo Market size is estimated to grow at a CAGR of 8.5 % over the forecast period.
Dry Shampoo Market Definition:
Dry shampoo is a hair care product that cleans hair without using water, restores hair strength and suppleness, and eliminates the need for water. Oil-absorbing components like cornstarch and kaolin, as well as odorless or aromatic aromas like parabens, make up the majority of the formula. Dry shampoo is primarily used to absorb excess oil and mask scents. The sebaceous glands create sebum, which is a fat combination of different fats. Protects hair from becoming brittle and dry by moisturizing it. Dry shampoo is a simple and quick way to treat an oily scalp without having to wash your hair too much. The global dry shampoo market report is analysed and studied by considering the segment analysis on the basis of form, end-user, distribution channel and region.
To get more Insights: Request Free Sample Report
Dry Shampoo Market Dynamics:
The organic and natural content of these products drives market demand. As women's hairstyle patterns change, there is growing concern about hair-related issues. Improve the standard of living of the upper class and those who work. These factors are driving the dry shampoo market growth.
An increasing number of innovative products, such as dry shampoo, a natural ingredient that removes odors and sweat and absorbs oils and impurities from the hair. These factors are expected to drive dry shampoo market growth over the forecast period.
The demand of the young population has had a significant impact on the growth of the hair care products market. The majority of the population also tends to spend a lot on high-quality hair care products. Due to the fresh and glossy appearance of the product, the demand for Generation X anti-aging products is increasing. These factors are driving product growth in the dry shampoo market.
The cost of these products is higher than regular wet shampoos and the disposable income is lower. These factors impede the market growth.
Dry Shampoo Market Segment Analysis:
By Form, the Spray category dominated the dry shampoo market with a market share of 64 % in 2025. The ability to administer the product to the hair's root is the main driver of segment expansion. Removes hair and scalp residues while also adding content and volume to the hair. The segment's demand is being driven by rising demand for waterless goods with natural ingredients like charcoal. These factors will drive the segment through the forecast period.
Through the forecast period, the powder segment of dry shampoo market is expected to grow at a CAGR of 7 %. Consumers who are concerned about chemical reactions to their hair utilize this method. Unlike sprays and foams, the powder blends nicely with the hair and scalp and distributes nutrients more evenly throughout the head. Throughout the projection period, these factors are expected to drive the segment's growth.
By End User, the Women segment dominated the market with a 60.3 % share in 2025. This product is marketed as a hair care product for celebrities and upper-class people. Shampoos that extend the life of dyes are becoming more widely available, and black-haired ladies prefer them since they still fight white hair. The a growing number of professional women who require more maintenance for their long hair in a short amount of time. These reasons are propelling the segment's expansion in the dry shampoo market.
Through the forecast period, the men's segment is expected to grow at a CAGR of 7.6 %. In the men's fashion and hair care industries, there is an increase in modern lifestyles and emerging trends. Shiny hair care products are slowly gaining popularity among males. Acceptance of ready-made items among the corporate population is growing, as is the acceptance of products in the men's grooming sector that saves time when it comes to hairstyling. Throughout the projection period, these variables are projected to drive product demand.
By Distribution Channel, the Offline distribution channel dominated the market with a 66 % share in 2025. Consumers are increasingly preferring to physically inspect and test things before making a purchase. Finding a diverse range of products across stores with real-time transaction negotiation. This segment is driven by simple price comparisons between different categories and brands. The appearance of trendy products in specialty stores, department stores, and other retail establishments. These reasons are propelling the segment's expansion in the dry shampoo market.
Through the forecast period, the online segment is expected to grow at a CAGR of 9.6 %. Consumers can shop for a large variety of products on e-commerce websites like Myntra, Amazon, Flipkart, etc. The online channel is seeing an increase in the number of offers, bargains, discount items, and major online retailers in the market. Through the forecast period, these factors are expected to drive the segment's growth in the dry shampoo market.
Dry Shampoo Market Regional Insights:
In 2024, North America dominated the dry shampoo market with a 42% share. As the population ages, demand for products is increasing due to the rise of application industries such as hair care products. Increasing demand for anti-aging products in conjunction with contemporary hairstyles, as well as a growth in the workforce and disposable money. These reasons are driving the market's demand for the goods.
Through the forecast period, the Asia Pacific region is expected to grow at a CAGR of 11 %. In the region, there has been an increase in demand for beauty and natural care goods. Consumer awareness of the beauty and personal well-being is growing. An increased young population increased disposable income, and other factors are expected to drive market expansion in this region through the forecast period.
Dry Shampoo Market Key Players Insights:
The dry shampoo market is characterized by the existence of a number of well-known firms. These companies control a large portion of the market, have a wide product portfolio, and have a global presence. In addition, the market comprises small to mid-sized competitors that sell a limited variety of items, some of which are self-publishing organizations.
The dry shampoo market's major companies have a significant impact because most of them have extensive global networks through which they can reach their massive client bases. To drive revenue growth and strengthen their positions in the global market, key players in the market, particularly in Europe and North America, are focusing on strategic initiatives such as acquisitions, new collection launches, and partnerships.
The objective of the report is to present a comprehensive analysis of the Global Dry Shampoo market to the stakeholders in the industry. The report provides trends that are most dominant in the Global Dry Shampoo market and how these trends will influence new business investments and market development throughout the forecast period. The report also aids in the comprehension of the Global Dry Shampoo Market dynamics and competitive structure of the market by analyzing market leaders, market followers, and regional players.
The qualitative and quantitative data provided in the Global Dry Shampoo market report is to help understand which market segments, regions are expected to grow at higher rates, factors affecting the market, and key opportunity areas, which will drive the industry and market growth through the forecast period. The report also includes the competitive landscape of key players in the industry along with their recent developments in the Global Dry Shampoo market. The report studies factors such as company size, market share, market growth, revenue, production volume, and profits of the key players in the global market.
The report provides Porter's Five Force Model, which helps in designing the business strategies in the market. The report helps in identifying how many rivals are existing, who they are, and how their product quality is in the Global Dry Shampoo market. The report also analyses if the Global Dry Shampoo market is easy for a new player to gain a foothold in the market, do they enter or exit the market regularly if the market is dominated by a few players, etc.
The report also includes a PESTEL Analysis, which aids in the development of company strategies. Political variables help in figuring out how much a government can influence the Global Dry Shampoo market. Economic variables aid in the analysis of economic performance drivers that have an impact on the Global Dry Shampoo market. Understanding the impact of the surrounding environment and the influence of environmental concerns on the global market is aided by legal factors.
Dry Shampoo Market Scope:
|
Dry Shampoo Market |
|
|
Market Size in 2025 |
USD 7.49 Bn. |
|
Market Size in 2032 |
USD 13.27 Bn. |
|
CAGR (2026-2032) |
8.5% |
|
Historic Data |
2020-2025 |
|
Base Year |
2025 |
|
Forecast Period |
2026-2032 |
|
Segment Scope |
By Form
|
|
By End User
|
|
|
By Distribution Channel
|
|
|
Regional Scope |
North America- United States, Canada, and Mexico Europe – UK, France, Germany, Italy, Spain, Sweden, Austria, and Rest of Europe Asia Pacific – China, India, Japan, South Korea, Australia, ASEAN, Rest of APAC Middle East and Africa - South Africa, GCC, Egypt, Nigeria, Rest of the Middle East and Africa South America – Brazil, Argentina, Rest of South America |
Dry Shampoo Market Key Players:
- Unilever (London, United Kingdom)
- Shiseido Company Ltd. (Tokyo, Japan)
- Procter & Gamble Company (Ohio, United States)
- Pierre Fabre (Paris, France)
- Revlon Inc. (New York, United States)
- Church & Dwight Co, Inc. (Ewing Township, New Jersey)
- New Avon LLC (New York, United States)
- The Estee Lauder Companies Inc. (New York, United States)
- L’Oreal SA (Paris, France)
- Henkel AG & Company (Düsseldorf, Germany)
- Kao Corporation (Tokyo, Japan)
- Coty Inc. (New York, United States)
- MacAndrews & Forbes Incorporated (United States)
- PHILOSOPHY INC. (New York, United States)
(* Key Players List Not Exhaustive)
Frequently Asked Questions
North American region is expected to hold the highest share in the Dry Shampoo Market.
The market size of the Dry Shampoo Market by 2032 is expected to reach USD 13.27 Billion
The forecast period for the Dry Shampoo Market is 2026-2032.
The market size of the Dry Shampoo Market in 2025 was valued at USD 7.49 Billion.
1. Research Methodology
1.1 Research Data
1.1.1. Primary Data
1.1.2. Secondary Data
1.2. Market Size Estimation
1.2.1. Bottom-Up Approach
1.2.2. Top-Up Approach
1.3. Market Breakdown and Data Triangulation
1.4. Research Assumption
2. Dry Shampoo Market Executive Summary
2.1. Market Overview
2.2. Market Size (2024) and Forecast (2025 – 2032) and Y-O-Y%
2.3. Market Size (USD) and Market Share (%) – By Segments and Regions
3. Global Dry Shampoo Market: Competitive Landscape
3.1. SMR Competition Matrix
3.2. Key Players Benchmarking
3.2.1. Company Name
3.2.2. Headquarter
3.2.3. Product Segment
3.2.4. Total Production (2024)
3.2.5. End-user Segment
3.2.6. Y-O-Y%
3.2.7. Revenue (2024)
3.2.8. Profit Magin
3.2.9. Market Share
3.2.10. Company Locations
3.3. Market Structure
3.3.1. Market Leaders
3.3.2. Market Followers
3.3.3. Emerging Players
3.4. Consolidation of the Market
3.4.1. Strategic Initiatives and Developments
3.4.2. Mergers and Acquisitions
3.4.3. Collaborations and Partnerships
3.4.4. Product Launches and Innovations
4. Dry Shampoo Market: Dynamics
4.1. Dry Shampoo Market Trends by Region
4.1.1. North America
4.1.2. Europe
4.1.3. Asia Pacific
4.1.4. Middle East and Africa
4.1.5. South America
4.2. Dry Shampoo Market Drivers
4.3. Dry Shampoo Market Restraints
4.4. Dry Shampoo Market Opportunities
4.5. Dry Shampoo Market Challenges
4.6. PORTER’s Five Forces Analysis
4.6.1. Intensity of the Rivalry
4.6.2. Threat of New Entrants
4.6.3. Bargaining Power of Suppliers
4.6.4. Bargaining Power of Buyers
4.6.5. Threat of Substitutes
4.7. PESTLE Analysis
4.7.1. Political Factors
4.7.2. Economic Factors
4.7.3. Social Factors
4.7.4. Legal Factors
4.7.5. Environmental Factors
4.8. Technological Roadmap
4.9. Value Chain Analysis and Supply Chain Analysis
4.10. Regulatory Landscape by Region
4.10.1. North America
4.10.2. Europe
4.10.3. Asia Pacific
4.10.4. Middle East and Africa
4.10.5. South America
5. Dry Shampoo Market: Global Market Size and Forecast by Segmentation (by Value in USD Million) (2024-2032)
5.1. Dry Shampoo Market Size and Forecast, by Form (2024-2032)
5.1.1. Spray
5.1.2. Powder
5.1.3. Others
5.2. Dry Shampoo Market Size and Forecast, by End User (2024-2032)
5.2.1. Men
5.2.2. Women
5.2.3. Children
5.3. Dry Shampoo Market Size and Forecast, by Distribution Channel (2024-2032)
5.3.1. Offline
5.3.2. Online
5.4. Dry Shampoo Market Size and Forecast, by Region (2024-2032)
5.4.1. North America
5.4.2. Europe
5.4.3. Asia Pacific
5.4.4. Middle East and Africa
5.4.5. South America
6. North America Dry Shampoo Market Size and Forecast by Segmentation (by Value in USD Million) (2024-2032)
6.1. North America Dry Shampoo Market Size and Forecast, by Form (2024-2032)
6.1.1. Spray
6.1.2. Powder
6.1.3. Others
6.2. North America Dry Shampoo Market Size and Forecast, by End User (2024-2032)
6.2.1. Men
6.2.2. Women
6.2.3. Children
6.3. North America Dry Shampoo Market Size and Forecast, by Distribution Channel (2024-2032)
6.3.1. Offline
6.3.2. Online
6.4. North America Dry Shampoo Market Size and Forecast, by Country (2024-2032)
6.4.1. United States
6.4.2. Canada
6.4.3. Mexico
7. Europe Dry Shampoo Market Size and Forecast by Segmentation (by Value in USD Million) (2024-2032)
7.1. Europe Dry Shampoo Market Size and Forecast, by Form (2024-2032)
7.2. Europe Dry Shampoo Market Size and Forecast, by End User (2024-2032)
7.3. Europe Dry Shampoo Market Size and Forecast, by Distribution Channel (2024-2032)
7.4. Europe Dry Shampoo Market Size and Forecast, by Country (2024-2032)
7.4.1. United Kingdom
7.4.2. France
7.4.3. Germany
7.4.4. Italy
7.4.5. Spain
7.4.6. Sweden
7.4.7. Austria
7.4.8. Rest of Europe
8. Asia Pacific Dry Shampoo Market Size and Forecast by Segmentation (by Value in USD Million) (2024-2032)
8.1. Asia Pacific Dry Shampoo Market Size and Forecast, by Form (2024-2032)
8.2. Asia Pacific Dry Shampoo Market Size and Forecast, by End User (2024-2032)
8.3. Asia Pacific Dry Shampoo Market Size and Forecast, by Distribution Channel (2024-2032)
8.4. Asia Pacific Dry Shampoo Market Size and Forecast, by Country (2024-2032)
8.4.1. China
8.4.2. S Korea
8.4.3. Japan
8.4.4. India
8.4.5. Australia
8.4.6. Indonesia
8.4.7. Malaysia
8.4.8. Vietnam
8.4.9. Taiwan
8.4.10. Rest of Asia Pacific
9. Middle East and Africa Dry Shampoo Market Size and Forecast by Segmentation (by Value in USD Million) (2024-2032)
9.1. Middle East and Africa Dry Shampoo Market Size and Forecast, by Form (2024-2032)
9.2. Middle East and Africa Dry Shampoo Market Size and Forecast, by End User (2024-2032)
9.3. Middle East and Africa Dry Shampoo Market Size and Forecast, by Distribution Channel (2024-2032)
9.4. Middle East and Africa Dry Shampoo Market Size and Forecast, by Country (2024-2032)
9.4.1. South Africa
9.4.2. GCC
9.4.3. Nigeria
9.4.4. Rest of ME&A
10. South America Dry Shampoo Market Size and Forecast by Segmentation (by Value in USD Million) (2024-2032)
10.1. South America Dry Shampoo Market Size and Forecast, by Form (2024-2032)
10.2. South America Dry Shampoo Market Size and Forecast, by End User (2024-2032)
10.3. South America Dry Shampoo Market Size and Forecast, by Distribution Channel (2024-2032)
10.4. South America Dry Shampoo Market Size and Forecast, by Country (2024-2032)
10.4.1. Brazil
10.4.2. Argentina
10.4.3. Rest Of South America
11. Company Profile: Key Players
11.1. Unilever (London, United Kingdom)
11.1.1. Company Overview
11.1.2. Business Portfolio
11.1.2.1. Product Name
11.1.2.2. Product Details (Price, Features, etc)
11.1.3. Financial Overview
11.1.3.1. Total Revenue
11.1.3.2. Segment Revenue
11.1.3.3. Regional Revenue
11.1.4. SWOT Analysis
11.1.5. Strategic Analysis
11.1.6. Recent Developments
11.2. Shiseido Company Ltd. (Tokyo, Japan)
11.3. Procter & Gamble Company (Ohio, United States)
11.4. Pierre Fabre (Paris, France)
11.5. Revlon Inc. (New York, United States)
11.6. Church & Dwight Co, Inc. (Ewing Township, New Jersey)
11.7. New Avon LLC (New York, United States)
11.8. The Estee Lauder Companies Inc. (New York, United States)
11.9. L’Oreal SA (Paris, France)
11.10. Henkel AG & Company (Düsseldorf, Germany)
11.11. Kao Corporation (Tokyo, Japan)
11.12. Coty Inc. (New York, United States)
11.13. MacAndrews & Forbes Incorporated (United States)
11.14. PHILOSOPHY INC. (New York, United States)
12. Key Findings
13. Analyst Recommendations
13.1. Strategic Recommendations
13.2. Future Outlook


