Cycling Wear Market Global Industry Analysis and Forecast (2026-2032) Trends, Statistics, Dynamics, Segmentation by Product, Distribution Channel, and Region
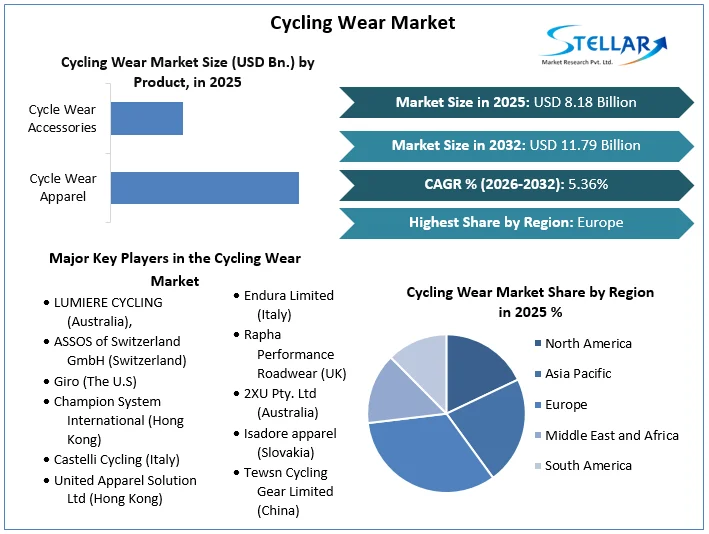
Cycling Wear Market was valued at USD 8.18 Bn. in 2025. Global Cycling Wear Market size is estimated to grow at a CAGR of 5.36 % over the forecast period.
Cycling Wear Market Definition:
Cycling wear includes cycling wear apparel and cycling wear accessories. Cycling wear apparel is being worn during cycling to fit and support the body during riding. These apparel are stretchable to provide extra comfort to the wearer. Cycling wear apparel includes products such as shorts, jackets, leggings, gloves, and jerseys among others. The cycling wear market report comes with the PORTER analysis, PESTLE analysis and segment analysis, based on the product, distribution channel and region along with the market size forecast.
Cycling Wear Market Dynamics:
Increasing the prevalence of chronic diseases such as hypertension, diabetes and obesity due to lifestyle changes and unhealthy eating habits will increase the cycling habits recommended by doctors and health coaches to maintain good health are driving the growth of the cycling wear market.
The increasing number of cycling events and the growing popularity of sporting events around the world are expected to create favourable opportunities for players active in the cycling wear market through the forecast period. Cycling apparel and gear manufacturers have developed a wide range of cycling apparel and gear to keep their customers loyal to their cycling apparel products.
To get more Insights: Request Free Sample Report
The market acceptance of highly visible cycling jackets is increasing. More than 7,100 cyclists in Denmark, cyclists wearing safety vests had a 47% lower accident rate than cyclists without jackets in 2020. These jackets make the wearer more visible to vehicular traffic and make them stand out against their background environment. Highly visible colors such as orange and yellow neon with designer retro reflective tape are commonly used for this application. These factors are driving the growth of the cycling wear market through the forecast period.
Cycling is becoming more and more important to people in many European countries such as the Netherlands, Finland and Germany. In April 2020, bicycles make up 27% of the daily travel of people in the country for various purposes such as leisure, work and shopping training. Increasing preference for using bicycles for daily activities is expected to have a positive impact on cycling wear market growth through the forecast period.
Manufacturers are focusing on cycling apparel fabrics because the climate and environment can have a significant impact on cycling. These garments are usually made of a unique material that allows moisture to escape. Moisture wicking is the process by which the fabric pulls sweat away from the skin and moves it away from the garment to keep the wearer cool. Companies are investing heavily in the research and development of these product lines to create innovative products and reduce sweating problems. These factors are driving the demand of the product in the cycling wear market.
With the growing popularity of adventure sports and events, several cycling events are held each year all over the world. International cycling races such as the Tour de Singkarak, Tour de Flores, Tour de Siak International Tour de, and Banyuwangi Ijen are just a few of the well-known events held each year to promote cycling and cycling tourism around the world. However, due to a drop in regional and international cycling events, the outbreak of the coronavirus pandemic in 2020 is predicted to stifle cycling wear market growth.
Many people are incorporating cycling as part of their lifestyle as a result of a growing number of health conditions such as diabetes, obesity, and high blood pressure, as well as a desire to maintain a healthy lifestyle. The popularity of bicycles and riding apparel is also influenced by public awareness of environmental issues. Throughout the year, a variety of cycling events are held, and the growing popularity of adventure sports is positively impacting the cycling wear market. Cycling clothing has grown in popularity as the urban population has become more interested in bicycles as a viable and cost-effective means of transportation.
Increasing government initiatives and rapidly developing cycling infrastructure such as bicycle crossings and parking facilities are major factors expected to drive growth of the global cycling wear market over the forecast period. In addition, increasing health awareness among consumers across the globe, owing to increasing rate of obesity is another factor expected to further fuel growth of the global market over the forecast period. Furthermore, rising consumer preference towards adoption of bicycles as sustainable mode of transportation and availability of various types of cyclic apparels are some other factors expected to boost growth of the target market.
Rising consumer demand for cycling as a hobby, growing awareness about living better lifestyles, and increased engagement in sports and fitness activities in various nations throughout the world are likely to enhance global market growth. The worldwide cyclic wear market is likely to be restrained by high-cost cyclic products and the increased usage of electric bicycles through the forecast period. Rising cycle death rates and improving automobile advances are two other variables that are predicted to slow the target market's growth in the near future.
Cycling Wear Market Segment Analysis:
By Product, The cycle wear apparel segment dominated the cycling wear market with 70 % share in 2025. There is a large selection of cycling wear apparel and clothing on the market. Leggings, shorts, gloves, beanies, tights jackets, and jerseys are all part of the cycling wear apparel category. These products are made of high-quality clothing that provides the rider with a high level of comfort as well as other features such as durability, moisture resistance, waterproofness, windproofness, and high visibility. Cycling clothing is designed to accommodate and support the body while cycling, thus it is composed of flexible material for added comfort. These factors are expected to drive the growth of the segment through the forecast period.
Cycle wear accessories are expected to expand at the fastest CAGR of 5 % through the forecast period. One of the important cycling wears is headgear or helmets, which offer safety and comfort to the rider during cycling. Manufacturers have been coming up with new technologies and innovations in relation to the development of the helmet. Recently, a cycling product manufacturing company, Trek and Bontrager launched a new helmet with WaveCel technology that claims to provide 48 times more protection than standard EPS foam at preventing concussion from common cycling accidents.
Cycling Wear Market Regional Insights:
Europe dominated the cycling wear market with 34 % share in 2025. Europe has seen a significant increase in the promotion of bicycle riding, and the market has been further penetrated with the advent of electric bicycles. About 73 % of Finland's population uses bicycles for a variety of activities, including office commutes and leisure rides. These factors are driving the demand of the market in this region.
Asia Pacific is expected to grow at a CAGR of 6 % through the forecast period. Cycling events have piqued the interest of countries like as South Korea, Japan, and China, which is expected to drive the regional market. Cycling activities in the country are expanding due to consumers' preference for high-quality cycling clothes and safety equipment. In Asia Pacific, China is one of the most important markets, while Japan and South Korea are emerging markets for cycle wear gear.
The objective of the report is to present a comprehensive analysis of the Global Cycling Wear market to the stakeholders in the industry. The report provides trends that are most dominant in the Global Cycling Wear market and how these trends will influence new business investments and market development throughout the forecast period. The report also aids in the comprehension of the global market dynamics and competitive structure of the market by analyzing market leaders, market followers, and regional players.
The qualitative and quantitative data provided in the Global Cycling Wear market report is to help understand which market segments, regions are expected to grow at higher rates, factors affecting the market, and key opportunity areas, which will drive the industry and market growth through the forecast period. The report also includes the competitive landscape of key players in the industry along with their recent developments in the Global Cycling Wear market. The report studies factors such as company size, market share, market growth, revenue, production volume, and profits of the key players in the global market.
The report provides Porter's Five Force Model, which helps in designing the business strategies in the market. The report helps in identifying how many rivals are existing, who they are, and how their product quality is in the Global Cycling Wear market. The report also analyses if the Global Cycling Wear market is easy for a new player to gain a foothold in the market, do they enter or exit the market regularly if the market is dominated by a few players, etc.
The report also includes a PESTEL Analysis, which aids in the development of company strategies. Political variables help in figuring out how much a government can influence the Global Cycling Wear market. Economic variables aid in the analysis of economic performance drivers that have an impact on the Global Cycling Wear market. Understanding the impact of the surrounding environment and the influence of environmental concerns on the Global Cycling Wear market is aided by legal factors.
Cycling Wear Market Scope:
|
Cycling Wear Market |
|
|
Market Size in 2025 |
USD 8.18 Bn. |
|
Market Size in 2032 |
USD 11.79 Bn. |
|
CAGR (2026-2032) |
5.36% |
|
Historic Data |
2020-2025 |
|
Base Year |
2025 |
|
Forecast Period |
2026-2032 |
|
Segment Scope |
By Product
|
|
By Distribution Channel
|
|
|
Regional Scope |
North America- United States, Canada, and Mexico Europe – UK, France, Germany, Italy, Spain, Sweden, Austria, and Rest of Europe Asia Pacific – China, India, Japan, South Korea, Australia, ASEAN, Rest of APAC Middle East and Africa - South Africa, GCC, Egypt, Nigeria, Rest of the Middle East and Africa South America – Brazil, Argentina, Rest of South America |
Cycling Wear Market Key Players:
- LUMIERE CYCLING (Australia),
- ASSOS of Switzerland GmbH (Switzerland)
- Giro (The U.S)
- Champion System International (Hong Kong)
- Castelli Cycling (Italy)
- United Apparel Solution Ltd (Hong Kong)
- Endura Limited (Italy)
- Rapha Performance Roadwear (UK)
- 2XU Pty. Ltd (Australia)
- Isadore apparel (Slovakia)
- Tewsn Cycling Gear Limited (China)
Frequently Asked Questions
Europe region is expected to hold the highest share in the Cycling Wear Market.
The market size of the Cycling Wear Market by 2032 is expected to reach US$ 11.79 Bn.
The forecast period for the Cycling Wear Market is 2026-2032.
The market size of the Cycling Wear Market in 2025 was valued at US$ 8.18 Bn.
1. Research Methodology
1.1 Research Data
1.1.1. Primary Data
1.1.2. Secondary Data
1.2. Market Size Estimation
1.2.1. Bottom-Up Approach
1.2.2. Top-Up Approach
1.3. Market Breakdown and Data Triangulation
1.4. Research Assumption
2. Cycling Wear Market Executive Summary
2.1. Market Overview
2.2. Market Size (2025) and Forecast (2026 – 2032) and Y-O-Y%
2.3. Market Size (USD) and Market Share (%) – By Segments and Regions
3. Global Cycling Wear Market: Competitive Landscape
3.1. SMR Competition Matrix
3.2. Key Players Benchmarking
3.2.1. Company Name
3.2.2. Headquarter
3.2.3. Product Segment
3.2.4. End-user Segment
3.2.5. Y-O-Y%
3.2.6. Revenue (2025)
3.2.7. Profit Magin
3.2.8. Market Share
3.2.9. Company Locations
3.3. Market Structure
3.3.1. Market Leaders
3.3.2. Market Followers
3.3.3. Emerging Players
3.4. Consolidation of the Market
3.4.1. Strategic Initiatives and Developments
3.4.2. Mergers and Acquisitions
3.4.3. Collaborations and Partnerships
3.4.4. Product Launches and Innovations
4. Cycling Wear Market: Dynamics
4.1. Cycling Wear Market Trends by Region
4.1.1. North America
4.1.2. Europe
4.1.3. Asia Pacific
4.1.4. Middle East and Africa
4.1.5. South America
4.2. Cycling Wear Market Drivers
4.3. Cycling Wear Market Restraints
4.4. Cycling Wear Market Opportunities
4.5. Cycling Wear Market Challenges
4.6. PORTER’s Five Forces Analysis
4.6.1. Intensity of the Rivalry
4.6.2. Threat of New Entrants
4.6.3. Bargaining Power of Suppliers
4.6.4. Bargaining Power of Buyers
4.6.5. Threat of Substitutes
4.7. PESTLE Analysis
4.7.1. Political Factors
4.7.2. Economic Factors
4.7.3. Social Factors
4.7.4. Legal Factors
4.7.5. Environmental Factors
4.8. Technological Roadmap
4.9. Value Chain Analysis
4.10. Regulatory Landscape by Region
4.10.1. North America
4.10.2. Europe
4.10.3. Asia Pacific
4.10.4. Middle East and Africa
4.10.5. South America
5. Cycling Wear Market: Global Market Size and Forecast by Segmentation (by Value in USD Million) (2025-2032)
5.1. Cycling Wear Market Size and Forecast, by Product (2025-2032)
5.1.1. Cycle Wear Apparel
5.1.2. Cycle Wear Accessories
5.2. Cycling Wear Market Size and Forecast, by Distribution Channel (2025-2032)
5.2.1. Hypermarket and Supermarket
5.2.2. Specialty Stores
5.2.3. E-Commerce
5.2.4. Others
5.3. Cycling Wear Market Size and Forecast, by Region (2025-2032)
5.3.1. North America
5.3.2. Europe
5.3.3. Asia Pacific
5.3.4. Middle East and Africa
5.3.5. South America
6. North America Cycling Wear Market Size and Forecast by Segmentation (by Value in USD Million) (2025-2032)
6.1. North America Cycling Wear Market Size and Forecast, by Product (2025-2032)
6.1.1. Cycle Wear Apparel
6.1.2. Cycle Wear Accessories
6.2. North America Cycling Wear Market Size and Forecast, by Distribution Channel (2025-2032)
6.2.1. Hypermarket and Supermarket
6.2.2. Specialty Stores
6.2.3. E-Commerce
6.2.4. Others
6.3. North America Cycling Wear Market Size and Forecast, by Country (2025-2032)
6.3.1. United States
6.3.2. Canada
6.3.3. Mexico
7. Europe Cycling Wear Market Size and Forecast by Segmentation (by Value in USD Million) (2025-2032)
7.1. Europe Cycling Wear Market Size and Forecast, by Product (2025-2032)
7.2. Europe Cycling Wear Market Size and Forecast, by Distribution Channel (2025-2032)
7.3. Europe Cycling Wear Market Size and Forecast, by Country (2025-2032)
7.3.1. United Kingdom
7.3.2. France
7.3.3. Germany
7.3.4. Italy
7.3.5. Spain
7.3.6. Sweden
7.3.7. Austria
7.3.8. Rest of Europe
8. Asia Pacific Cycling Wear Market Size and Forecast by Segmentation (by Value in USD Million) (2025-2032)
8.1. Asia Pacific Cycling Wear Market Size and Forecast, by Product (2025-2032)
8.2. Asia Pacific Cycling Wear Market Size and Forecast, by Distribution Channel (2025-2032)
8.3. Asia Pacific Cycling Wear Market Size and Forecast, by Country (2025-2032)
8.3.1. China
8.3.2. S Korea
8.3.3. Japan
8.3.4. India
8.3.5. Australia
8.3.6. Indonesia
8.3.7. Malaysia
8.3.8. Vietnam
8.3.9. Taiwan
8.3.10. Rest of Asia Pacific
9. Middle East and Africa Cycling Wear Market Size and Forecast by Segmentation (by Value in USD Million) (2025-2032)
9.1. Middle East and Africa Cycling Wear Market Size and Forecast, by Product (2025-2032)
9.2. Middle East and Africa Cycling Wear Market Size and Forecast, by Distribution Channel (2025-2032)
9.3. Middle East and Africa Cycling Wear Market Size and Forecast, by Country (2025-2032)
9.3.1. South Africa
9.3.2. GCC
9.3.3. Nigeria
9.3.4. Rest of ME&A
10. South America Cycling Wear Market Size and Forecast by Segmentation (by Value in USD Million) (2025-2032)
10.1. South America Cycling Wear Market Size and Forecast, by Product (2025-2032)
10.2. South America Cycling Wear Market Size and Forecast, by Distribution Channel (2025-2032)
10.3. South America Cycling Wear Market Size and Forecast, by Country (2025-2032)
10.3.1. Brazil
10.3.2. Argentina
10.3.3. Rest Of South America
11. Company Profile: Key Players
11.1. LUMIERE CYCLING (Australia)
11.1.1. Company Overview
11.1.2. Business Portfolio
11.1.2.1. Product Name
11.1.2.2. Product Details (Price, Features, etc)
11.1.3. Financial Overview
11.1.3.1. Total Revenue
11.1.3.2. Segment Revenue
11.1.3.3. Regional Revenue
11.1.4. SWOT Analysis
11.1.5. Strategic Analysis
11.1.6. Recent Developments
11.2. ASSOS of Switzerland GmbH (Switzerland)
11.3. Giro (The U.S)
11.4. Champion System International (Hong Kong)
11.5. Castelli Cycling (Italy)
11.6. United Apparel Solution Ltd (Hong Kong)
11.7. Endura Limited (Italy)
11.8. Rapha Performance Roadwear (UK)
11.9. 2XU Pty. Ltd (Australia)
11.10. Isadore apparel (Slovakia)
11.11. Tewsn Cycling Gear Limited (China)
12. Key Findings
13. Analyst Recommendations
13.1. Strategic Recommendations
13.2. Future Outlook


