Blockchain-as-a-Service Market Industry Forecast (2026-2032) by Application, Organization Size, Vertical and, Region
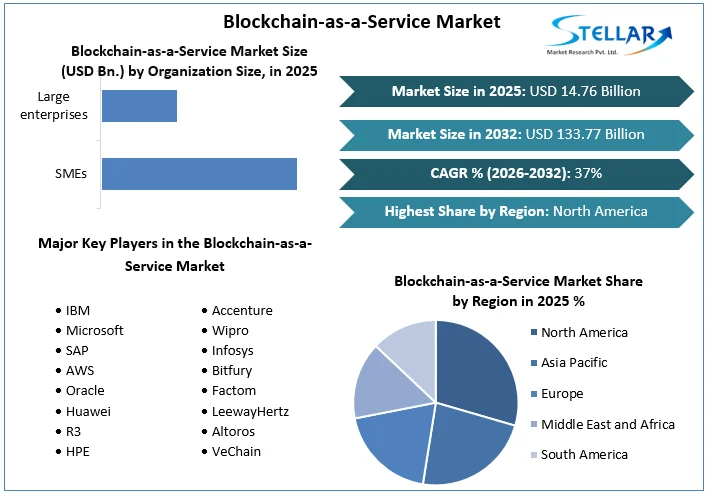
Blockchain-as-a-Service Market size was valued at US$ 14.76 Billion in 2025 and the total Blockchain-as-a-Service revenue is expected to grow at 37 % through 2026 to 2032 reaching nearly US$ 133.77 Billion.
Blockchain-as-a-Service Market Overview:
With its rapid growth, blockchain technology, also known as the basis of Bitcoin, has been employed in a variety of areas, ushering in a new economy. A plethora of blockchain-based applications and services have recently developed. However, most developers still lack a simple and effective means to deploy, manage, and monitor their applications, making it impossible for them to assure their apps' dependability and security. Blockchain-as-a-Service Market report's segment analysis is studied by considering the segment on the basis of appliaction, organization size, vertical and region.
Blockchain-as-a-Service is a type of cloud computing that provides benefits that are comparable to those of the cloud in general. In other words, the service provider makes use of economies of scale to offer managed computing, storage, networking, security, and other services to consumers on demand. Adopters may save considerable capital and recurring costs as a result of this. Cloud also provides elasticity, allowing it to flexibly manage increases and drops in computing demands as needed.
Blockchain is projected to provide several security features, including decentralization, encryption, and cryptography, to safeguard healthcare industry privacy following the breakout of COVID-19. The COVID-19 outbreak has resulted in a surge in eCommerce demand. To function successfully in a pandemic, technologies such as Artificial Intelligence, Machine Learning, and Blockchain are beginning to drive company innovation initiatives, which has driven the Blockchain-as-a-Service market, among small and medium enterprises. Following the onset of the COVID-19 pandemic, businesses are using fintech and blockchain technologies to simplify and modernize their processes.
To get more Insights: Request Free Sample Report
Blockchain-as-a-Service Market Dynamics:
The rising demand due to the coronavirus pandemic is one of the major drivers of the blockchain-as-a-service market. Several firms were forced to close owing to health and safety concerns, as well as the unprecedented demand for specialized items like PPE kits and medical aid. Due to the rising demand for these items, various consumers are feeling forced to get supplies from unknown origins or quality. Long supply chains provide a lot of ambiguity, making it difficult to quantify and plan the complete supply chain. The ideal solution for supply chains is blockchain, which can connect all participants into a single supply chain network while retaining transparency and safely breaking down data silos. As a result, the supply chain process has a large number of blockchain arrangements, which surged during the COVID-19 outbreak.
A major restraint of the blockchain-as-a-service market is the uncertain regulatory landscape of the blockchain industry. Regulations may stymie the deployment of the blockchain-as-a-service innovation in different parts of the world. To prevent fraudulent cross-border transactions, governments are enacting a variety of rules. For example, in February 2018, Japan enacted laws to regulate bitcoin throughout the country, while India just prohibited cryptocurrency trading. Furthermore, several governments are financing research to learn more about blockchain and how to use it. Some aspects of a blockchain deployment, such as land registry, legal agreements, and financial institution decentralization, are significantly dependent on favorable rules.
The key opportunity in the blockchain-as-a-service market is the synergy between the Internet of Things and blockchain technology. Blockchain technology has the potential to develop a safe and flexible foundation for IoT device connectivity. While traditional security procedures looked to be susceptible when applied to IoT systems, blockchain has already shown to be very resistant to intrusions. Furthermore, smart gadgets can do automatic micro-transactions thanks to technology. Blockchain transactions will be quicker and cheaper due to their distributed nature. Agreements, which will be deemed the amicable settlement, are used by IoT devices to permit the transfer of money or data.
Blockchain-as-a-Service Market Segment Analysis:
By Organization Size, the SMEs held over 45% share of the global market in 2025. SMEs are expected to witness a CAGR of 9.3% in the forecast period. Small & Medium Enterprises choose cloud-based connectivity over on-premises networking solutions because they are more flexible and cost less. The implementation of BaaS is expected to be driven by SMEs' embrace of the pay-as-you-go strategy to flexibly manage IT infrastructure according to their needs. In addition, the requirement for efficient customer data security and cost-cutting, as well as gaining a competitive edge, enables rapid reaction and prompt choices, which is expected to propel the blockchain-as-a-service market in SMEs forward. Also expected to encourage the growth of the blockchain as a service market in SMEs are reasons such as the need for efficient customer data security, cost-cutting, gaining a competitive edge, and rapid reaction and prompt choices.
Blockchain-as-a-Service Market Regional Insights:
The majority of BFSI, commerce, medical, and manufacturing end customers in North America have begun to integrate blockchain technology throughout their operations. Food security, polling, and shipment are just a few of the applications for blockchain that have been effectively implemented outside of the bitcoin end user. The Canadian government is experimenting with blockchain technology in order to encourage economic innovation, resulting in a plethora of prospects for blockchain-as-a-service suppliers and boosting the blockchain-as-a-service market.
The region's need for BaaS is likely to be fueled by the growing use of blockchain technology by SMEs and large corporations to improve procedures in domains like health data, supply-chain management, and governance. The demand for blockchain-as-a-service is projected to be fueled by the increased usage of blockchain among software industries for creating apps on it. The demand for a BaaS is growing in the region as a result of technological advancements and a growing focus on making supply chain services such as logistics, warehousing, fulfillment, manufacturing, and transportation management more efficient.
The purpose of this research is to provide stakeholders in the industry with a thorough insight into the Blockchain-as-a-Service Market. The study includes an analysis of difficult data in simple language, as well as the industry's historical and current state, as well as anticipated market size and trends. The market report examines all segments of the industry, with a focus on significant players such as market leaders, followers, and new entrants. The report includes a PORTER, PESTEL analysis as well as the possible influence of microeconomic market determinants. External and internal elements that are expected to have a favorable or negative impact on the firm have been examined, providing decision-makers with a clear future vision of the industry. The research also aids in comprehending the Blockchain-as-a-Service Market dynamics and structure by studying market segments and forecasting market size. The research is an investor's guide since it depicts the competitive analysis of major competitors in the Blockchain-as-a-Service Market by product, price, financial situation, product portfolio, growth plans, and geographical presence.
Breakthroughs in the Blockchain-as-a-Service industry are discussed, as well as organic and inorganic growth plans. Various companies are focusing on organic growth strategies such as new product releases, product approvals, and other items such as patents and events. Inorganic growth strategies used in the industry included acquisitions, partnerships, and collaborations.
Blockchain-as-a-Service Market Scope:
|
Blockchain-as-a-ServiceMarket |
|
|
Market Size in 2025 |
USD 14.76 Bn. |
|
Market Size in 2032 |
USD 133.77 Bn. |
|
CAGR (2026-2032) |
37 % |
|
Historic Data |
2020-2025 |
|
Base Year |
2025 |
|
Forecast Period |
2026-2032 |
|
Segment Scope |
By Application
|
|
By Organization Size
|
|
|
By Vertical
|
|
|
Regional Scope |
North America- United States, Canada, and Mexico Europe – UK, France, Germany, Italy, Spain, Sweden, Austria, and Rest of Europe Asia Pacific – China, India, Japan, South Korea, Australia, ASEAN, Rest of APAC Middle East and Africa - South Africa, GCC, Egypt, Nigeria, Rest of the Middle East and Africa South America – Brazil, Argentina, Rest of South America |
Blockchain-as-a-Service Market Players:
Frequently Asked Questions
The rising demand for blockchain-as-a-service due to the coronavirus pandemic is one of the major drivers of the market.
The key players in the Blockchain-as-a-Service Market are SAP, AWS etc.
the SMEs held over 45% share of the global market in 2025. SMEs are expected to witness a CAGR of 37 % in the forecast period.
1. Blockchain-as-a-Service Market: Research Methodology
1.1. Research Data
1.1.1. Primary Data
1.1.2. Secondary Data
1.2. Market Size Estimation
1.2.1. Bottom-Up Approach
1.2.2. Top-Down Approach
1.3. Market Breakdown and Data Triangulation
1.4. Research Assumptions
2. Blockchain-as-a-Service Market: Executive Summary
2.1. Market Overview
2.2. Market Size (2025) and Forecast (2026 – 2032) and Y-O-Y%
2.3. Market Size (USD) and Market Share (%) – By Segments and Regions
3. Blockchain-as-a-Service Market: Competitive Landscape
3.1. Stellar Competition Matrix
3.2. Key Players Benchmarking
3.2.1. Company Name
3.2.2. Headquarter
3.2.3. Business Segment
3.2.4. End-user Segment
3.2.5. Y-O-Y%
3.2.6. Revenue (2025)
3.2.7. Profit Margin
3.2.8. Market Share
3.2.9. Company Locations
3.3. Market Structure
3.3.1. Market Leaders
3.3.2. Market Followers
3.3.3. Emerging Players
3.4. Consolidation of the Market
3.4.1. Strategic Initiatives and Developments
3.4.2. Mergers and Acquisitions
3.4.3. Collaborations and Partnerships
4. Blockchain-as-a-Service Market: Dynamics
4.1. Market Trends by Region
4.1.1. North America
4.1.2. Europe
4.1.3. Asia Pacific
4.1.4. Middle East and Africa
4.1.5. South America
4.2. Market Drivers
4.3. Market Restraints
4.4. Market Opportunities
4.5. Market Challenges
4.6. PORTER’s Five Forces Analysis
4.6.1. Intensity of the Rivalry
4.6.2. Threat of New Entrants
4.6.3. Bargaining Power of Suppliers
4.6.4. Bargaining Power of Buyers
4.6.5. Threat of Substitutes
4.7. PESTLE Analysis
4.7.1. Political Factors
4.7.2. Economic Factors
4.7.3. Social Factors
4.7.4. Technological Factors
4.7.5. Legal Factors
4.7.6. Environmental Factors
4.8. Technological Roadmap
4.9. Regulatory Landscape
4.9.1. Market Regulation by Region
4.9.1.1. North America
4.9.1.2. Europe
4.9.1.3. Asia Pacific
4.9.1.4. Middle East and Africa
4.9.1.5. South America
4.9.2. Impact of Regulations on Market Dynamics
4.9.3. Government Schemes and Initiatives
5. Blockchain-as-a-Service Market Size and Forecast by Segments (by Value USD Million)
5.1. Blockchain-as-a-Service Market Size and Forecast, By Application (2025-2032)
5.1.1. Supply Chain Management
5.1.2. Smart Contracts
5.1.3. Identity Management
5.1.4. Payments
5.1.5. Governance, Risk, and Compliance Management
5.1.6. Others
5.2. Blockchain-as-a-Service Market Size and Forecast, By Organization Size (2025-2032)
5.2.1. SMEs
5.2.2. Large Enterprise
5.3. Blockchain-as-a-Service Market Size and Forecast, By Vertical (2025-2032)
5.3.1. BFSI
5.3.2. Healthcare
5.3.3. Manufacturing
5.3.4. Retail and Ecommerce
5.3.5. Transportation and Logistics
5.3.6. Government and Public Sector
5.3.7. Energy and Utilities
5.4. Blockchain-as-a-Service Market Size and Forecast, by Region (2025-2032)
5.4.1. North America
5.4.2. Europe
5.4.3. Asia Pacific
5.4.4. Middle East and Africa
5.4.5. South America
6. North America Blockchain-as-a-Service Market Size and Forecast (by Value USD Million)
6.1. North America Blockchain-as-a-Service Market Size and Forecast, By Application (2025-2032)
6.1.1. Supply Chain Management
6.1.2. Smart Contracts
6.1.3. Identity Management
6.1.4. Payments
6.1.5. Governance, Risk, and Compliance Management
6.1.6. Others
6.2. North America Blockchain-as-a-Service Market Size and Forecast, By Organization Size (2025-2032)
6.2.1. SMEs
6.2.2. Large Enterprise
6.3. North America Blockchain-as-a-Service Market Size and Forecast, By Vertical (2025-2032)
6.3.1. BFSI
6.3.2. Healthcare
6.3.3. Manufacturing
6.3.4. Retail and Ecommerce
6.3.5. Transportation and Logistics
6.3.6. Government and Public Sector
6.3.7. Energy and Utilities
6.4. North America Blockchain-as-a-Service Market Size and Forecast, by Country (2025-2032)
6.4.1. United States
6.4.2. Canada
6.4.3. Mexico
7. Europe Blockchain-as-a-Service Market Size and Forecast (by Value USD Million)
7.1. Europe Blockchain-as-a-Service Market Size and Forecast, By Application (2025-2032)
7.1.1. Supply Chain Management
7.1.2. Smart Contracts
7.1.3. Identity Management
7.1.4. Payments
7.1.5. Governance, Risk, and Compliance Management
7.1.6. Others
7.2. Europe Blockchain-as-a-Service Market Size and Forecast, By Organization Size (2025-2032)
7.2.1. SMEs
7.2.2. Large Enterprise
7.3. Europe Blockchain-as-a-Service Market Size and Forecast, By Vertical (2025-2032)
7.3.1. BFSI
7.3.2. Healthcare
7.3.3. Manufacturing
7.3.4. Retail and Ecommerce
7.3.5. Transportation and Logistics
7.3.6. Government and Public Sector
7.3.7. Energy and Utilities
7.4. Europe Blockchain-as-a-Service Market Size and Forecast, by Country (2025-2032)
7.4.1. UK
7.4.2. France
7.4.3. Germany
7.4.4. Italy
7.4.5. Spain
7.4.6. Sweden
7.4.7. Austria
7.4.8. Rest of Europe
8. Asia Pacific Blockchain-as-a-Service Market Size and Forecast (by Value USD Million)
8.1. Asia Pacific Blockchain-as-a-Service Market Size and Forecast, By Application (2025-2032)
8.1.1. Supply Chain Management
8.1.2. Smart Contracts
8.1.3. Identity Management
8.1.4. Payments
8.1.5. Governance, Risk, and Compliance Management
8.1.6. Others
8.2. Asia Pacific Blockchain-as-a-Service Market Size and Forecast, By Organization Size (2025-2032)
8.2.1. SMEs
8.2.2. Large Enterprise
8.3. Asia Pacific Blockchain-as-a-Service Market Size and Forecast, By Vertical (2025-2032)
8.3.1. BFSI
8.3.2. Healthcare
8.3.3. Manufacturing
8.3.4. Retail and Ecommerce
8.3.5. Transportation and Logistics
8.3.6. Government and Public Sector
8.3.7. Energy and Utilities
8.4. Asia Pacific Blockchain-as-a-Service Market Size and Forecast, by Country (2025-2032)
8.4.1. China
8.4.2. S Korea
8.4.3. Japan
8.4.4. India
8.4.5. Australia
8.4.6. Indonesia
8.4.7. Malaysia
8.4.8. Vietnam
8.4.9. Taiwan
8.4.10. Bangladesh
8.4.11. Pakistan
8.4.12. Rest of Asia Pacific
9. Middle East and Africa Blockchain-as-a-Service Market Size and Forecast (by Value USD Million)
9.1. Middle East and Africa Blockchain-as-a-Service Market Size and Forecast, By Application (2025-2032)
9.1.1. Supply Chain Management
9.1.2. Smart Contracts
9.1.3. Identity Management
9.1.4. Payments
9.1.5. Governance, Risk, and Compliance Management
9.1.6. Others
9.2. Middle East and Africa Blockchain-as-a-Service Market Size and Forecast, By Organization Size (2025-2032)
9.2.1. SMEs
9.2.2. Large Enterprise
9.3. Middle East and Africa Blockchain-as-a-Service Market Size and Forecast, By Vertical (2025-2032)
9.3.1. BFSI
9.3.2. Healthcare
9.3.3. Manufacturing
9.3.4. Retail and Ecommerce
9.3.5. Transportation and Logistics
9.3.6. Government and Public Sector
9.3.7. Energy and Utilities
9.4. Middle East and Africa Blockchain-as-a-Service Market Size and Forecast, by Country (2025-2032)
9.4.1. South Africa
9.4.2. GCC
9.4.3. Egypt
9.4.4. Nigeria
9.4.5. Rest of ME&A
10. South America Blockchain-as-a-Service Market Size and Forecast (by Value USD Million)
10.1. South America Blockchain-as-a-Service Market Size and Forecast, By Application (2025-2032)
10.1.1. Supply Chain Management
10.1.2. Smart Contracts
10.1.3. Identity Management
10.1.4. Payments
10.1.5. Governance, Risk, and Compliance Management
10.1.6. Others
10.2. South America Blockchain-as-a-Service Market Size and Forecast, By Organization Size (2025-2032)
10.2.1. SMEs
10.2.2. Large Enterprise
10.3. South America Blockchain-as-a-Service Market Size and Forecast, By Vertical (2025-2032)
10.3.1. BFSI
10.3.2. Healthcare
10.3.3. Manufacturing
10.3.4. Retail and Ecommerce
10.3.5. Transportation and Logistics
10.3.6. Government and Public Sector
10.3.7. Energy and Utilities
10.4. South America Blockchain-as-a-Service Market Size and Forecast, by Country (2025-2032)
10.4.1. Brazil
10.4.2. Argentina
10.4.3. Rest of South America
11. Company Profile: Key players
11.1. IBM
11.1.1. Company Overview
11.1.2. Business Segment
11.1.3. Financial Overview
11.1.3.1. Total Revenue
11.1.3.2. Segment Revenue
11.1.3.3. Regional Revenue
11.1.4. SWOT Analysis
11.1.5. Strategic Analysis
11.1.6. Recent Developments
11.2. Microsoft
11.3. SAP
11.4. AWS
11.5. Oracle
11.6. Huawei
11.7. R3
11.8. HPE
11.9. Accenture
11.10. Wipro
11.11. Infosys
11.12. Bitfury
11.13. Factom
11.14. LeewayHertz
11.15. Altoros
11.16. VeChain
12. Key Findings
13. Industry Recommendations
13.1. Strategic Recommendations
13.2. Future Outlook


