Agriculture Packaging Market Global Industry Analysis and Forecast (2026-2032) by Material, Product, and Region
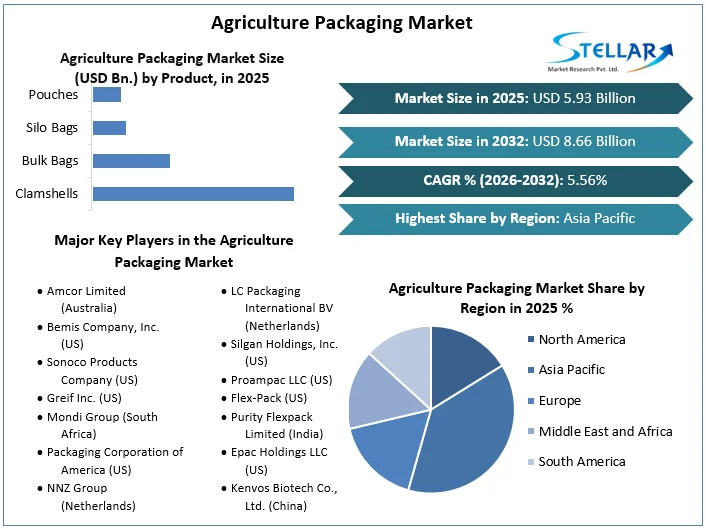
The Agriculture Packaging Market size was valued at US$ 5.93 Bn in 2025. The Global Agriculture Packaging Market is estimated to grow at a CAGR of 5.56% over the forecast period.
Agriculture Packaging Market Definition:
The act of wrapping or enclosing agricultural products in a suitable material that will protect them as they are carried from farms to markets and exhibited for consumers to buy is known as packaging. Agricultural packaging is important because it protects agricultural products while also extending their shelf life. Every day, for example, hundreds of pounds of edible food are wasted owing to inadequate supply chain management. The Global report on the Agriculture Packaging Market is provided with the segment analysis on the basis of material, product and region.
Every year, it is estimated that one-third of the food produced in the globe is wasted, amounting to around 1.33 billion tonnes of food. If good packing can aid in the reduction of this vast food waste, it is critical to strike a balance between packaging waste and food waste. Consumers are drawn to high-quality packaging techniques. The link between a gleaming outside and the supposed superiority of its contents is strong, and it is an important aspect of marketing. As a result of these factors, the global Agriculture Packaging Market is in high demand.
To get more Insights: Request Free Sample Report
Agriculture Packaging Market Dynamics:
The expansion of the market is being influenced by plastic packaging which is fuelling the growth of the market:
Consumers like flexible packaging, there is a growing need for it. According to the Flexible Packaging Association, more than 60% of North American consumers are willing to pay for benefits such as product protection, supply chain efficiency, and shipping friendliness, among others. Plastics, both inflexible and flexible, are the most widely used packaging medium for pesticides and fertilisers. One of the factors pushing plastics rising appeal in this area is its frivolous, durable, and cost-effective manufacture. In contrast to paperboard, metal, and glass packaging materials, they are widely used in packaging for these reasons. The increased demand for plastic packaging due the great effective advantages is expected to drive agriculture packaging market growth.
Packaging design is also influenced by plastics. Modified atmosphere packaging, for example, keeps food fresh by encapsulating a low-oxygen air combination in a plastic package. Farmers, processors, and distributors who sell in global and national marketplaces can use this technology to extend the shelf life of their products by reducing the growth of germs.
The market's expansion is being hampered by raw material prices have been unstable, and also the recycling of used and discarded packaging materials:
Petroleum and crude oil, are used to make plastics. The sector faces a huge issue in balancing the pricing of packaging products due to the high volatility of oil prices. Due to the confinement of hazardous chemicals inside agrochemical packaging, recycling of packaging waste has been a difficulty across the industrial packaging industry, and even more so for agrochemical packaging. As lockdowns relax and companies reopen, raw material costs have soared throughout 2021. Construction, automobile manufacture, e-commerce, and other industries use many of the same basic ingredients. The unstable raw material prices hampers the agriculture packaging market growth.
Agricultural Product Packaging is in High Demand to Extend Shelf Life which is providing a major opportunity for the market:
Agricultural packaging is important because it protects agricultural products while also extending their shelf life. Every day, for example, hundreds of pounds of edible food are wasted owing to inadequate supply chain management. Every year, it is estimated that one-third of the food produced in the globe is wasted, amounting to around 1.33 billion tonnes of food. If good packing can aid in the reduction of this vast food waste, it is critical to strike a balance between packaging waste and food waste. Consumers are drawn to high-quality packaging techniques. The link between a gleaming outside and the supposed superiority of its contents is strong, and it is an important aspect of marketing. As a result of these factors, the agriculture packaging market is in high demand and creating a huge opportunity for the market.
Large volumes of packaging materials are not readily available which presents a challenging factor for the market:
Less stringent packaging standards without risking food safety could help the industry grow. Allowing the use of recycled packing materials when there is no risk of contamination is one example. Poor handling, distribution, storage, and purchase consumption behaviour are all blamed for large losses from farm to end consumers. Manufacturing and shipping things that just go to waste consume a lot of resources that may be better spent on more profitable tasks are creating a major challenging factor for the agriculture packaging market.
Agriculture Packaging Market Segment Analysis:
By Material, the market is segmented as Plastic, Metal, Paper & Paperboard, Composite Raw Material and Others. The Plastic segment dominated the agriculture packaging market with a 38.8% share in 2025.
Plastic's increasing use in this market can be attributable to its lightweight, sturdy, and cost-effective manufacturing characteristics, which are boosting demand for this segment. Flexible plastics and stiff plastics are two types of plastics that can be found in the market. Plastic is widely used in the packaging of insecticides and fertilisers. Because low-cost raw materials like polythene are readily available, the plastic segment is expected to grow during the forecast period.
However, the Paper & Paperboard segment is expected to grow at a CAGR of 4.6% through the forecast period. Paper, paperboard, and cardboard cartons are extensively used in both retail and shipping packaging. For shipping, storing, and even promoting products, corrugated cardboard provides exceptional structural stability.
By Product, the market is segmented as Clamshells, Bulk Bags, Silo Bags, Pouches, and Others. The Bulk Bags segment dominated the agriculture packaging market with a 31.3% share in 2025. Bulk bags are likely to dominate the farm packaging market, and this dominance is expected to continue during the forecast period. Thousands of pounds of dry products can be stored and transported in bulk bags. Because of the enhanced shelf life for products, temperature control within the packaging, printing opportunities for branding and food labelling, and low cost, bulk bags have been widely employed in the industry.
Agriculture Packaging Market Regional Insights:
The Asia Pacific region dominated the agriculture packaging market with a 38.2% share in 2025. The rising economies of China and India, which feed the increasing demand for food supply and hence raise demand packaging in the region, are the leading contributors to the expansion of agricultural packaging in the Asia Pacific. Similarly, due to its resident’s modern lifestyles and food requirements, the Southeast Asian sub-region has seen a surge in the processed food sector. APAC's developing economies contribute significantly to the production of agricultural foods like cereals, roots and tubers, oilseeds and pulses, fruits and vegetables, animal products, and seafood, accounting for 50–70% of global total production. As a result of the vast amount of production in the agricultural food sector in the Asia Pacific, the worldwide packaging industry has a potentially huge investment market, as packaging is a key component of the value chain of agricultural food products.
The objective of the report is to present a comprehensive analysis of the Global Agriculture packaging market to the stakeholders in the industry. The report provides trends that are most dominant in the Global Agriculture packaging market and how these trends will influence new business investments and market development throughout the forecast period. The report also aids in the comprehension of the Global Agriculture packaging Market dynamics and competitive structure of the market by analyzing market leaders, market followers, and regional players.
The qualitative and quantitative data provided in the Global Agriculture packaging market report is to help understand which market segments, regions are expected to grow at higher rates, factors affecting the market, and key opportunity areas, which will drive the industry and market growth through the forecast period. The report also includes the competitive landscape of key players in the industry along with their recent developments in the Global Agriculture packaging market. The report studies factors such as company size, market share, market growth, revenue, production volume, and profits of the key players in the global market.
The report provides Porter's Five Force Model, which helps in designing the business strategies in the market. The report helps in identifying how many rivals are existing, who they are, and how their product quality is in the Global Agriculture packaging market. The report also analyses if the Global Agriculture packaging market is easy for a new player to gain a foothold in the market, do they enter or exit the market regularly if the market is dominated by a few players, etc.
The report also includes a PESTEL Analysis, which aids in the development of company strategies. Political variables help in figuring out how much a government can influence the Global Agriculture packaging market. Economic variables aid in the analysis of economic performance drivers that have an impact on the Global Agriculture packaging market. Understanding the impact of the surrounding environment and the influence of environmental concerns on the global market is aided by legal factors.
Agriculture Packaging Market Scope:
|
Agriculture Packaging Market |
|
|
Market Size in 2025 |
USD 5.93 Bn. |
|
Market Size in 2032 |
USD 8.66 Bn. |
|
CAGR (2026-2032) |
5.56% |
|
Historic Data |
2020-2025 |
|
Base Year |
2025 |
|
Forecast Period |
2026-2032 |
|
Segment Scope |
By Material
|
|
By Product
|
|
|
Regional Scope |
North America- United States, Canada, and Mexico Europe – UK, France, Germany, Italy, Spain, Sweden, Austria, and Rest of Europe Asia Pacific – China, India, Japan, South Korea, Australia, ASEAN, Rest of APAC Middle East and Africa - South Africa, GCC, Egypt, Nigeria, Rest of the Middle East and Africa South America – Brazil, Argentina, Rest of South America |
Agriculture Packaging Market Key Players:
- Amcor Limited (Australia)
- Bemis Company, Inc. (US)
- Sonoco Products Company (US)
- Greif Inc. (US)
- Mondi Group (South Africa)
- Packaging Corporation of America (US)
- NNZ Group (Netherlands)
- LC Packaging International BV (Netherlands)
- Silgan Holdings, Inc. (US)
- Proampac LLC (US)
- Flex-Pack (US)
- Purity Flexpack Limited (India)
- Epac Holdings LLC (US)
- Kenvos Biotech Co., Ltd. (China)
- Parakh Group (India)
Frequently Asked Questions
The Asia Pacific region is expected to hold the highest share in the Agriculture packaging Market
The market size of the Agriculture packaging Market is expected to be 8.66 Bn by 2032.
The forecast period for the Agriculture packaging Market is 2026-2032
The market size of the Agriculture packaging Market in 2025 was USD 5.93 Bn.
1. Research Methodology
1.1 Research Data
1.1.1. Primary Data
1.1.2. Secondary Data
1.2. Market Size Estimation
1.2.1. Bottom-Up Approach
1.2.2. Top-Down Approach
1.3. Market Breakdown and Data Triangulation
1.4. Research Assumption
2. Agriculture Packaging Market Executive Summary
2.1. Market Overview
2.2. Market Size (2025) and Forecast (2026 – 2032) and Y-O-Y%
2.3. Market Size (USD) and Market Share (%) – By Segments and Regions
3. Agriculture Packaging Market: Competitive Landscape
3.1. SMR Competition Matrix
3.2. Key Players Benchmarking
3.2.1. Company Name
3.2.2. Headquarter
3.2.3. Product Segment
3.2.4. Total Production (2025)
3.2.5. End-user Segment
3.2.6. Y-O-Y%
3.2.7. Revenue (2025)
3.2.8. Profit Margin
3.2.9. Company Locations
3.3. Market Structure
3.3.1. Market Leaders
3.3.2. Market Followers
3.3.3. Emerging Players
3.4. Consolidation of the Market
3.4.1. Strategic Initiatives and Developments
3.4.2. Mergers and Acquisitions
3.4.3. Collaborations and Partnerships
3.4.4. Product Launches and Innovations
4. Agriculture Packaging Market: Dynamics
4.1. Agriculture Packaging Market Trends by Region
4.1.1. North America
4.1.2. Europe
4.1.3. Asia Pacific
4.1.4. Middle East and Africa
4.1.5. South America
4.2. Agriculture Packaging Market Drivers
4.3. Agriculture Packaging Market Restraints
4.4. Agriculture Packaging Market Opportunities
4.5. Agriculture Packaging Market Challenges
4.6. PORTER’s Five Forces Analysis
4.6.1. Intensity of the Rivalry
4.6.2. Threat of New Entrants
4.6.3. Bargaining Power of Suppliers
4.6.4. Bargaining Power of Buyers
4.6.5. Threat of Substitutes
4.7. PESTLE Analysis
4.7.1. Political Factors
4.7.2. Economic Factors
4.7.3. Social Factors
4.7.4. Technological Factors
4.7.5. Legal Factors
4.7.6. Environmental Factors
4.8. Value Chain Analysis and Supply Chain Analysis
4.9. Trade Analysis
4.9.1. Import Scenario
4.9.2. Export Scenario
4.10. Technological Roadmap
4.11. Regulatory Landscape
4.11.1. Market Regulation by Region
4.11.1.1. North America
4.11.1.2. Europe
4.11.1.3. Asia Pacific
4.11.1.4. Middle East and Africa
4.11.1.5. South America
4.11.2. Impact of Regulations on Market Dynamics
4.11.3. Government Schemes and Initiatives
5. Agriculture Packaging Market: Global Market Size and Forecast by Segmentation (by Value in USD Million and Volume in Units) (2025-2032)
5.1. Agriculture Packaging Market Size and Forecast, by Material (2025-2032)
5.1.1. Plastic
5.1.2. Metal
5.1.3. Paper & Paperboard
5.1.4. Composite Raw Material
5.1.5. Others
5.2. Agriculture Packaging Market Size and Forecast, by Product (2025-2032)
5.2.1. Clamshells
5.2.2. Bulk Bags
5.2.3. Silo Bags
5.2.4. Pouches
5.2.5. Others
5.3. Agriculture Packaging Market Size and Forecast, by Region (2025-2032)
5.3.1. North America
5.3.2. Europe
5.3.3. Asia Pacific
5.3.4. Middle East and Africa
5.3.5. South America
6. North America Agriculture Packaging Market and Forecast by Segmentation (by Value in USD Million and Volume in Units) (2025-2032)
6.1. North America Agriculture Packaging Market Size and Forecast, by Material (2025-2032)
6.1.1. Plastic
6.1.2. Metal
6.1.3. Paper & Paperboard
6.1.4. Composite Raw Material
6.1.5. Others
6.2. North America Agriculture Packaging Market Size and Forecast, by Product (2025-2032)
6.2.1. Clamshells
6.2.2. Bulk Bags
6.2.3. Silo Bags
6.2.4. Pouches
6.2.5. Others
6.3. North America Agriculture Packaging Market Size and Forecast, by Country (2025-2032)
6.3.1. United States
6.3.2. Canada
6.3.3. Mexico
7. Europe Agriculture Packaging Market Size and Forecast by Segmentation (by Value in USD Million and Volume in Units) (2025-2032)
7.1. Europe Agriculture Packaging Market Size and Forecast, by Material (2025-2032)
7.2. Europe Agriculture Packaging Market Size and Forecast, by Product (2025-2032)
7.3. Europe Agriculture Packaging Market Size and Forecast, by Country (2025-2032)
7.3.1. United Kingdom
7.3.2. France
7.3.3. Germany
7.3.4. Italy
7.3.5. Spain
7.3.6. Sweden
7.3.7. Austria
7.3.8. Rest of Europe
8. Asia Pacific Agriculture Packaging Market Size and Forecast by Segmentation (by Value in USD Million and Volume in Units) (2025-2032)
8.1. Asia Pacific Agriculture Packaging Market Size and Forecast, by Material (2025-2032)
8.2. Asia Pacific Agriculture Packaging Market Size and Forecast, by Product (2025-2032)
8.3. Asia Pacific Agriculture Packaging Market Size and Forecast, by Country (2025-2032)
8.3.1. China
8.3.2. S Korea
8.3.3. Japan
8.3.4. India
8.3.5. Australia
8.3.6. Indonesia
8.3.7. Malaysia
8.3.8. Vietnam
8.3.9. Taiwan
8.3.10. Rest of Asia Pacific
9. Middle East and Africa Agriculture Packaging Market Size and Forecast by Segmentation (by Value in USD Million and Volume in Units) (2025-2032)
9.1. Middle East and Africa Agriculture Packaging Market Size and Forecast, by Material (2025-2032)
9.2. Middle East and Africa Agriculture Packaging Market Size and Forecast, by Product (2025-2032)
9.3. Middle East and Africa Agriculture Packaging Market Size and Forecast, by Country (2025-2032)
9.3.1. South Africa
9.3.2. GCC
9.3.3. Nigeria
9.3.4. Rest of ME&A
10. South America Agriculture Packaging Market Size and Forecast by Segmentation (by Value in USD Million and Volume in Units) (2025-2032)
10.1. South America Agriculture Packaging Market Size and Forecast, by Material (2025-2032)
10.2. South America Agriculture Packaging Market Size and Forecast, by Product (2025-2032)
10.3. South America Agriculture Packaging Market Size and Forecast, by Country (2025-2032)
10.3.1. Brazil
10.3.2. Argentina
10.3.3. Rest Of South America
11. Company Profile: Key Players
11.1. Amcor Limited (Australia)
11.1.1. Company Overview
11.1.2. Business Portfolio
11.1.3. Financial Overview
11.1.3.1. Total Revenue
11.1.3.2. Segment Revenue
11.1.3.3. Regional Revenue
11.1.4. SWOT Analysis
11.1.5. Strategic Analysis
11.1.6. Recent Developments
11.2. Bemis Company, Inc. (US)
11.3. Sonoco Products Company (US)
11.4. Greif Inc. (US)
11.5. Mondi Group (South Africa)
11.6. Packaging Corporation of America (US)
11.7. NNZ Group (Netherlands)
11.8. LC Packaging International BV (Netherlands)
11.9. Silgan Holdings, Inc. (US)
11.10. Proampac LLC (US)
11.11. Flex-Pack (US)
11.12. Purity Flexpack Limited (India)
11.13. Epac Holdings LLC (US)
11.14. Kenvos Biotech Co., Ltd. (China)
11.15. Parakh Group (India)
12. Key Findings
13. Analyst Recommendations
13.1. Strategic Recommendations
13.2. Future Outlook