Agriculture Analytics Market - Global Industry Analysis and Forecast (2026-2032) by Type, Application, Farm Size and Region
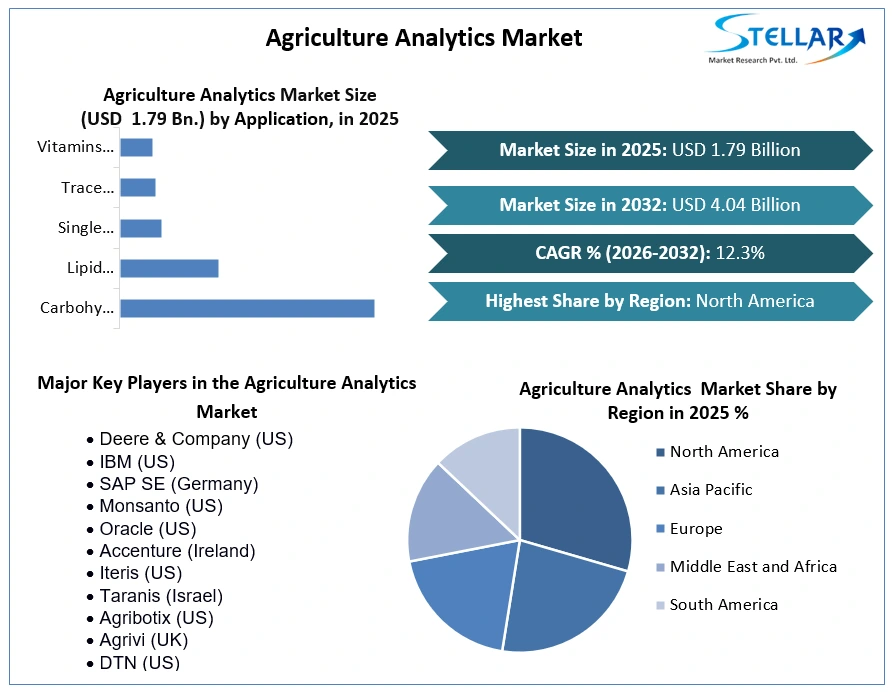
The Agriculture Analytics Market size was valued at USD 1.79 Bn in 2025. The Global Agriculture Analytics Market is estimated to grow at a CAGR of 12.3% over the forecast period.
Agriculture Analytics Market Definition:
Agriculture analytics are used to improve farming processes and make informed judgments using complementing technology such as satellites, drones, and others. SAS agriculture analytics with AI lets extract useful data that can lead to improved plant and animal health, crop yields, and sustainable practices, among other things. It also manages plant, soil, and animal health product research data. It may also use to boost precision agriculture efficiency. The Agriculture Analytics Market report's segment analysis is provided on the basis of type, farm size, application and region.
Farmers can use data analytics to track the health of their crops in real-time, generate predictive analytics for future yields, and make resource management decisions based on proven trends. Reducing waste and increasing revenues are two goals that have been set for consumers. Agriculture analytics is the use of leading-edge expertise in agricultural farming, such as Big Data, IoT, and other analytics apparatuses.
To get more Insights: Request Free Sample Report
Agriculture Analytics Market Dynamics:
Government initiatives to deploy new farming techniques are becoming more prevalent which is fuelling the growth of the agriculture analytics market:
Robots, temperature and moisture sensors, aerial photographs, and GPS technology will all be used in the future of agriculture analytics. Farms will be more profitable, efficient, safe, and environmentally friendly as a result of this modern equipment, precision agriculture, and robotic systems. Renewable energy, zero tillage, biotechnology, organic farming, vertical farming, irrigation, drones, fleet organisation, and digital sensors are among the top green technologies and methods that are helping to make farming more environmentally sustainable which is generally initiated by the government.
However, the government also use new and progressive technology, combined into one system, to assist farmers and other participants in the agriculture value chain to boost food production is known as digital agriculture. The combined data is then examined and construed so that the farmer can make better-informed decisions.
The market's expansion is being hampered by the high cost of technology investment:
Farm apparatus has developed in size, speed, and efficiency as a result of technological progressions, allowing for more efficient farming of more land. Seed, irrigation, and fertilisers have all improved dramatically, allowing farmers to enhance harvests. This investment in various technology is very expensive. Apart from this, Farmers are unable to effectively operate machines due to a lack of practical knowledge. The expense of maintenance, on the other hand, is extremely significant. Overuse of machines has the potential to harm the environment. Because the majority of farmers are illiterates, they are unable to use modern machinery which is a major reason for hampering the growth of the agriculture analytics market.
The growing popularity of vertical or urban farming is providing a major opportunity for the agriculture analytics industry:
In the last 10–15 years, urban farming has developed increasingly popular. It has been frequently driven by the rising development of developing regions in the developing world. Finding new and better farming machinery is a crucial aspect of long-term sustainability. There are various advantages included in agriculture analytics such as increased production in much less space, shorter growing seasons, less water consumption, fresh produce grown considerably closer to where it is consumed, and according to Aero Farm management, it also gives better food flavour which is considered a huge opportunity for the agriculture analytics market.
Agriculture Analytics Market Segment Analysis:
By Application, the market is segmented as Farming, Livestock, Aquaculture, and Others. The Farming segment dominated the market with a 38.8% share in 2025. Agriculture includes farming. They have a lot in mutual as well as a lot of alterations. Agriculture comprises a wide range of activities, comprising production, research, and development, as well as farming. Farming, on the other hand, is the commotion or business of raising crops and cattle which is highly used to boost this segment in the agriculture analytics market.
However, the Livestock segment is expected to grow at a CAGR of 12.3% through the forecast period. Livestock includes cattle, sheep, horses, goats, and other domestic animals raised or used on the farm. Turkeys and domesticated fowl are considered poultry, not livestock, under the rules of this exemption.
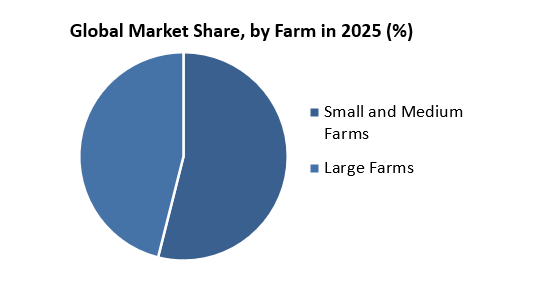
By Farm Size, the Agriculture Analytics Market is segmented as Small and Medium Farms and Large Farms. During the forecast period, the revenue growth rate of the Large farm sector is expected to be the fastest. Farmers can use agriculture analytics to increase production and improve overall farm efficiency because large farms have better economic conditions than small and medium farms. Agriculture analytics solutions are projected to be in high demand among large farms as the requirement to fulfil rising food demand and weather extremes grow. Large farms are increasingly using big data IoT devices to monitor their operations and collect data about tractor availability, among other things.
By Type, the market is segmented as Farm Analytics and Livestock Analytics. The Farm Analytics segment dominated the agriculture analytics market with a 68% share in 2024. Artificial intelligence and data science are being used by agriculture researchers to do on-farm predictive analytics before offering the insights that matter in the farming world. The growing subscription-based business model attempts to reduce costs for farmers while also providing real-time crop alerts. Furthermore, prediction models and daily work optimization will offer them entire control over their harvest in the future which is a major reason for driving the growth of this segment.
Agriculture Analytics Market Regional Insights:
The North American region dominated the agriculture analytics market with a 46.5% share in 2024. The considerable presence of technology providers and expanding government initiatives towards smart farming are the key driving forces for the expansion of the North American geographic segment. To stay competitive in the regional and global landscape, these companies focus on partnerships, mergers and acquisitions, and creative solution offerings.
However, In the United States, emerging technology-enabled agriculture has a large market share. The Federal Communications Commission announced in July 2019 that it would create a new task group to advise them on how to ensure farmers and ranchers have the connection they need to use and profit from precision agriculture. This task force will collaborate with USDA to provide policy recommendations to encourage the quick and widespread deployment of broadband internet service in unserved agricultural land, to have strong capabilities on 95% of US agricultural land by 2025.
The objective of the report is to present a comprehensive analysis of the Global Agriculture Analytics Market to the stakeholders in the industry. The report provides trends that are most dominant in the Global Agriculture analytics market and how these trends will influence new business investments and market development throughout the forecast period. The report also aids in the comprehension of the Global Agriculture Analytics Market dynamics and competitive structure of the market by analyzing market leaders, market followers, and regional players.
The qualitative and quantitative data provided in the Global Agriculture analytics market report is to help understand which market segments, regions are expected to grow at higher rates, factors affecting the market, and key opportunity areas, which will drive the industry and market growth through the forecast period. The report also includes the competitive landscape of key players in the industry along with their recent developments in the Global Agriculture analytics market. The report studies factors such as company size, market share, market growth, revenue, production volume, and profits of the key players in the global market.
The report provides Porter's Five Force Model, which helps in designing the business strategies in the market. The report helps in identifying how many rivals are existing, who they are, and how their product quality is in the Global Agriculture analytics market. The report also analyses if the Global Agriculture analytics market is easy for a new player to gain a foothold in the market, do they enter or exit the market regularly if the market is dominated by a few players, etc.
The report also includes a PESTEL Analysis, which aids in the development of company strategies. Political variables help in figuring out how much a government can influence the Global Agriculture analytics market. Economic variables aid in the analysis of economic performance drivers that have an impact on the global Agriculture analytics market. Understanding the impact of the surrounding environment and the influence of environmental concerns on the global market is aided by legal factors.
Agriculture Analytics Market Scope:
|
Agriculture Analytics Market |
|
|
Market Size in 2025 |
USD 1.79 Bn. |
|
Market Size in 2032 |
USD 4.04 Bn. |
|
CAGR (2026-2032) |
12.3% |
|
Historic Data |
2020-2025 |
|
Base Year |
2025 |
|
Forecast Period |
2026-2032 |
|
Segment Scope |
by Application
|
|
by Farm Size
|
|
|
by Type
|
|
|
Regional Scope |
North America- United States, Canada, and Mexico Europe – UK, France, Germany, Italy, Spain, Sweden, Austria, and Rest of Europe Asia Pacific – China, India, Japan, South Korea, Australia, ASEAN, Rest of APAC Middle East and Africa - South Africa, GCC, Egypt, Nigeria, Rest of the Middle East and Africa South America – Brazil, Argentina, Rest of South America |
Agriculture Analytics Market Key Players:
- Deere & Company (US)
- IBM (US)
- SAP SE (Germany)
- Monsanto (US)
- Oracle (US)
- Accenture (Ireland)
- Iteris (US)
- Taranis (Israel)
- Agribotix (US)
- Agrivi (UK)
- DTN (US)
- Conservis Corporation (US)
- DeLaval (Sweden)
- FBN (US)
- Farmers Edge (US)
- GEOSYS (US)
- Granular (US)
- Gro Intelligence (US)
- Proagrica (UK)
Frequently Asked Questions
The North American region is expected to hold the highest share in the Agriculture analytics Market.
The market size of the Agriculture Analytics Market is expected to be 4.04 Bn by 2032.
The forecast period for the Agriculture Analytics Market is 2026-2032
The market size of the Agriculture Analytics Market in 2025 was US$ 1.79 Bn.
1. Research Methodology
1.1 Research Data
1.1.1. Primary Data
1.1.2. Secondary Data
1.2. Market Size Estimation
1.2.1. Bottom-Up Approach
1.2.2. Top-Down Approach
1.3. Market Breakdown and Data Triangulation
1.4. Research Assumption
2. Agriculture Analytics Market Executive Summary
2.1. Market Overview
2.2. Market Size (2025) and Forecast (2026– 2032) and Y-O-Y%
2.3. Market Size (USD) and Market Share (%) – By Segments and Regions
3. Agriculture Analytics Market: Competitive Landscape
3.1. SMR Competition Matrix
3.2. Key Players Benchmarking
3.2.1. Company Name
3.2.2. Headquarter
3.2.3. Business Segment
3.2.4. End-user Segment
3.2.5. Y-O-Y%
3.2.6. Revenue (2025)
3.2.7. Company Locations
3.3. Market Structure
3.3.1. Market Leaders
3.3.2. Market Followers
3.3.3. Emerging Players
3.4. Consolidation of the Market
3.4.1. Strategic Initiatives
3.4.2. Mergers and Acquisitions
3.4.3. Collaborations and Partnerships
3.4.4. Developments and Innovations
3.5. Agriculture Analytics Industry Ecosystem
3.5.1. Ecosystem Analysis
3.5.2. Role of the Companies in the Ecosystem
4. Agriculture Analytics Market: Dynamics
4.1. Agriculture Analytics Market Trends by Region
4.1.1. North America
4.1.2. Europe
4.1.3. Asia Pacific
4.1.4. Middle East and Africa
4.1.5. South America
4.2. Agriculture Analytics Market Drivers
4.3. Agriculture Analytics Market Restraints
4.4. Agriculture Analytics Market Opportunities
4.5. Agriculture Analytics Market Challenges
4.6. PORTER’s Five Forces Analysis
4.6.1. Intensity of the Rivalry
4.6.2. Threat of New Entrants
4.6.3. Bargaining Power of Suppliers
4.6.4. Bargaining Power of Buyers
4.6.5. Threat of Substitutes
4.7. PESTLE Analysis
4.7.1. Political Factors
4.7.2. Economic Factors
4.7.3. Social Factors
4.7.4. Technological Factors
4.7.5. Legal Factors
4.7.6. Environmental Factors
4.8. Technological Analysis
4.8.1. GIS-based agriculture
4.8.2. Sensor technology
4.8.3. Blockchain
4.8.4. Sky-drones
4.8.5. Robotics and automation technology
4.8.6. Technological Roadmap
4.9. Regulatory Landscape
4.9.1. Market Regulation by Region
4.9.1.1. North America
4.9.1.2. Europe
4.9.1.3. Asia Pacific
4.9.1.4. Middle East and Africa
4.9.1.5. South America
4.9.2. Impact of Regulations on Market Dynamics
4.9.3. Government Schemes and Initiatives
5. Agriculture Analytics Market: Global Market Size and Forecast by Segmentation (by Value in USD Million) (2026-2032)
5.1. Agriculture Analytics Market Size and Forecast, by Application (2025-2032)
5.1.1. Farming
5.1.2. Livestock
5.1.3. Aquaculture
5.1.4. Others
5.2. Agriculture Analytics Market Size and Forecast, by Farm Size (2025-2032)
5.2.1. Small and Medium Farms
5.2.2. Large Farms
5.3. Agriculture Analytics Market Size and Forecast, by Type (2025-2032)
5.3.1. Farm Analytics
5.3.2. Livestock Analytics
5.4. Agriculture Analytics Market Size and Forecast, by Region (2025-2032)
5.4.1. North America
5.4.2. Europe
5.4.3. Asia Pacific
5.4.4. Middle East and Africa
5.4.5. South America
6. North America Agriculture Analytics Market Size and Forecast by Segmentation (by Value in USD Million) (2026-2032)
6.1. North America Agriculture Analytics Market Size and Forecast, by Application (2025-2032)
6.1.1. Farming
6.1.2. Livestock
6.1.3. Aquaculture
6.1.4. Others
6.2. North America Agriculture Analytics Market Size and Forecast, by Farm Size (2025-2032)
6.2.1. Small and Medium Farms
6.2.2. Large Farms
6.3. North America Agriculture Analytics Market Size and Forecast, by Type (2025-2032)
6.3.1. Farm Analytics
6.3.2. Livestock Analytics
6.4. North America Agriculture Analytics Market Size and Forecast, by Country (2025-2032)
6.4.1. United States
6.4.2. Canada
6.4.3. Mexico
7. Europe Agriculture Analytics Market Size and Forecast by Segmentation (by Value in USD Million) (2026-2032)
7.1. Europe Agriculture Analytics Market Size and Forecast, by Application (2025-2032)
7.2. Europe Agriculture Analytics Market Size and Forecast, by Farm Size (2025-2032)
7.3. Europe Agriculture Analytics Market Size and Forecast, by Type (2025-2032)
7.4. Europe Agriculture Analytics Market Size and Forecast, by Country (2025-2032)
7.4.1. United Kingdom
7.4.2. France
7.4.3. Germany
7.4.4. Italy
7.4.5. Spain
7.4.6. Sweden
7.4.7. Austria
7.4.8. Rest of Europe
8. Asia Pacific Agriculture Analytics Market Size and Forecast by Segmentation (by Value in USD Million) (2026-2032)
8.1. Asia Pacific Agriculture Analytics Market Size and Forecast, by Application (2025-2032)
8.2. Asia Pacific Agriculture Analytics Market Size and Forecast, by Farm Size (2025-2032)
8.3. Asia Pacific Agriculture Analytics Market Size and Forecast, by Type (2025-2032)
8.4. Asia Pacific Agriculture Analytics Market Size and Forecast, by Country (2025-2032)
8.4.1. China
8.4.2. S Korea
8.4.3. Japan
8.4.4. India
8.4.5. Australia
8.4.6. Indonesia
8.4.7. Malaysia
8.4.8. Vietnam
8.4.9. Taiwan
8.4.10. Rest of Asia Pacific
9. Middle East and Africa Agriculture Analytics Market Size and Forecast by Segmentation (by Value in USD Million) (2026-2032)
9.1. Middle East and Africa Agriculture Analytics Market Size and Forecast, by Application (2025-2032)
9.2. Middle East and Africa Agriculture Analytics Market Size and Forecast, by Farm Size (2025-2032)
9.3. Middle East and Africa Agriculture Analytics Market Size and Forecast, by Type (2025-2032)
9.4. Middle East and Africa Agriculture Analytics Market Size and Forecast, by Country (2025-2032)
9.4.1. South Africa
9.4.2. GCC
9.4.3. Nigeria
9.4.4. Rest of ME&A
10. South America Agriculture Analytics Market Size and Forecast by Segmentation (by Value in USD Million) (2026-2032)
10.1. South America Agriculture Analytics Market Size and Forecast, by Application (2025-2032)
10.2. South America Agriculture Analytics Market Size and Forecast, by Farm Size (2025-2032)
10.3. South America Agriculture Analytics Market Size and Forecast, by Type (2025-2032)
10.4. South America Agriculture Analytics Market Size and Forecast, by Country (2025-2032)
10.4.1. Brazil
10.4.2. Argentina
10.4.3. Rest Of South America
11. Company Profile: Key Players
11.1. Deere & Company (US)
11.1.1. Company Overview
11.1.2. Business Portfolio
11.1.3. Financial Overview
11.1.3.1. Total Revenue
11.1.3.2. Segment Revenue
11.1.3.3. Regional Revenue
11.1.4. SWOT Analysis
11.1.5. Strategic Analysis
11.1.6. Recent Developments
11.2. IBM (US)
11.3. SAP SE (Germany)
11.4. Monsanto (US)
11.5. Oracle (US)
11.6. Accenture (Ireland)
11.7. Iteris (US)
11.8. Taranis (Israel)
11.9. Agribotix (US)
11.10. Agrivi (UK)
11.11. DTN (US)
11.12. Conservis Corporation (US)
11.13. DeLaval (Sweden)
11.14. FBN (US)
11.15. Farmers Edge (US)
11.16. GEOSYS (US)
11.17. Granular (US)
11.18. Gro Intelligence (US)
11.19. Proagrica (UK)
12. Key Findings
13. Analyst Recommendations
13.1. Strategic Recommendations
13.2. Future Outlook