Tube Packaging Market Global Industry Analysis, Trends, and Forecast 2032
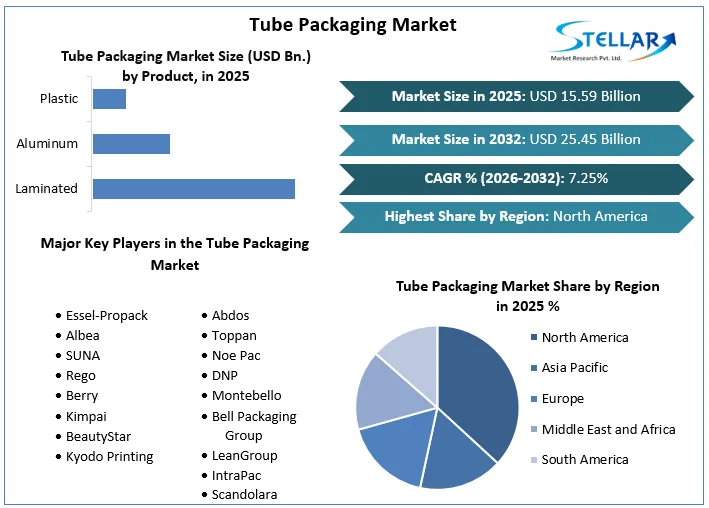
Tube Packaging Market was valued at USD 15.59 billion in 2025. Global Tube Packaging Market size is estimated to grow at a CAGR of 7.25 % over the forecast period.
Tube Packaging Market Definition:
Tubes are hollow, cylindrical containers made of plastic, aluminum, or cardboard that hold sticky substances like ointments, toothpaste, and adhesives. Both ends of the tube are treated differently during the manufacturing and filling process. The body of the tube has an oval aperture at one end that can be sealed with a cap and closure. Fold or close the opposite end after adding the contents. Tube packing containers are extruded and then personalized, functional, and unique packaging is created by printing, labeling, stamping, cutting, crimping, and other methods. This tube packaging market report's segment analysis is studied and prepared on the basis of tube, product, application and region.
To get more Insights: Request Free Sample Report
Tube Packaging Market Dynamics:
The rise of diverse businesses such as cosmetics, toiletries, and medicines has a significant impact on the tube packaging market. The business is expected to grow dramatically in the Asia-Pacific area over the next few years, thanks to a flourishing middle-class population. Emerging markets for tube packaging include India, China, Saudi Arabia, Russia, and Brazil, which are predicted to grow substantially throughout the projection period.
Domestic demand for organic personal care products is quickly expanding due to shifting consumer desires for natural components. Organic products are typically marketed in small amounts and at a high cost, necessitating the use of tube packaging to ensure efficient and accurate dispensing.
Increased restrictions on the usage of plastics are likely to open doors for other materials like bioplastics and metal. Cornstarch, sugar cane, chips, tapioca root, and other starches are used to make renewable energy plastics such as polylactic acid. Polylactic acid (PLA) is the most widely used bioplastic on the planet. Biodegradability, recyclability, and non-toxicity are important factors increasing global demand for bioplastics, which in turn is driving tube packaging market growth.
Distributors are largely responsible for delivering products to end-users, such as pharmaceutical and cosmetics producers. Many global end-users, on the other hand, are in direct touch with manufacturers to save costs and maintain consistent supply. Some tube packaging manufacturers allow users to communicate directly with their suppliers and consumers, enhancing both parties' profitability by lowering distribution costs and allowing users to order directly from their website. These reasons are driving the tube packaging market forward.
Plastics created from renewable biomass sources such as vegetable fats and oils, cornstarch, straw, wood chips, sawdust, and recovered food waste are known as bioplastics. Agricultural by-products and recycled plastics can both be used to make bioplastics. Agriculture, consumer products, textiles, autos and transportation, construction, and construction are just a few of the industries that employ bioplastics. Bioplastics are utilized in flexible packaging because they are environmentally friendly and degrade quickly. Bioplastics are the most widely used in the packaging industry, and their use is growing globally as a result of rising environmental concerns. Bioplastics provide the packaging sector with renewable and sustainable alternatives for a wide range of uses. Bioplastic-based tube packaging goods, as a result, are in high demand on the tube packaging market.
Polyethylene, polyethylene terephthalate, and polypropylene are the most common plastic materials. The pricing of these polymers is very susceptible to changes in crude oil prices. Market growth is expected to be limited by fluctuating commodity prices, such as plastics, aluminum, and other laminates.
Alternative packaging technologies, such as bags and sachets, compete with tubes. Tubes are desirable when the product is pasty or thick, however, they are not recommended for liquids. Tubes are one of the greatest packaging alternatives for paste-like items since the contents can be readily put into the tubes and all types of printing procedures can be done at a reasonable cost. The tube packaging market's expansion is being restrained by these factors.
Various countries' governments have enacted severe laws to reduce the impact of garbage and its toxic by-products on the environment, animal, and plant health. To decrease the accumulation of solid trash in landfills, they also implemented severe restrictions on the disposal of consumer and industrial plastic garbage. To develop new and creative packages, companies must invest a significant amount of money in research. The raw components used are biodegradable garbage, according to regulatory officials. Packaging must be both sustainable and cost-effective, according to the packaging industry. Biodegradable raw materials are more expensive than conventional ones. This raises the cost of production. This raises the price of the product, limiting the expansion of the tube packaging market.
Tube Packaging Market Segment Analysis:
By Tube, squeeze and collapsible segment dominated the tube packaging market with a 71 % share in 2025. Product penetration is increasing in end-user industries such as personal and oral care, as well as healthcare. Because it is lightweight, shatterproof, and leak-proof, the plastic squeeze type is the most widely used product. The laminated foldable aluminum type is commonly utilized in health and dental care applications. When pressure is released, folding tubes do not return to their previous shape, making them ideal for packing ointments and creams. These reasons are propelling the segment's expansion in the market.
Through the projected period, the twisted segment is expected to grow at a CAGR of 6.18 %. These are commonly found in consumer products like gums, adhesives, and paints, as well as soft solid products like adhesives, perfume oils, and lipsticks. The segment's major attributes driving demand are ease of use and precise dosing. It's suitable for packing expensive goods because of its improved barrier protection and limited storage capacity. Throughout the forecast period, these factors are expected to drive the segment's growth in the tube packaging market.
Tube Packaging Market Regional Insights:
With a market share of 38 % in 2025, the North American region dominated the industry. Many medium-sized firms in the tube packaging market in this region are willing to meet the demands of the consumer industry. Because of the ease of production and printing, laminated tubing and extruded plastic tubing have become the preferred materials in the region. These factors are driving the tube packaging industry in the market forward.
Through the forecast period, the Asia Pacific region is expected to increase at a CAGR of 8 %. Increased population leads to increased consumption of commodities, disposable income, and the presence of big actors, among other things. India, China, and South Korea have evolved as the region's primary manufacturing centers. Throughout the forecast period, these factors are expected to fuel the expansion of the tube packaging market.
Tube Packaging Market Key Players Insights:
The market is characterized by the existence of a number of well-known firms. These companies control a large portion of the market, have a wide product portfolio, and have a global presence. In addition, the market comprises small to mid-sized competitors that sell a limited variety of items, some of which are self-publishing organizations.
The market's major companies have a significant impact because most of them have extensive global networks through which they can reach their massive client bases. To drive revenue growth and strengthen their positions in the global tube packaging market, key players in the market, particularly in Europe and North America, are focusing on strategic initiatives such as acquisitions, new collection launches, and partnerships.
The objective of the report is to present a comprehensive analysis of the Global Tube Packaging market to the stakeholders in the industry. The report provides trends that are most dominant in the Global Tube Packaging market and how these trends will influence new business investments and market development throughout the forecast period. The report also aids in the comprehension of the Global Tube Packaging Market dynamics and competitive structure of the market by analyzing market leaders, market followers, and regional players.
The qualitative and quantitative data provided in the Global Tube Packaging market report is to help understand which market segments, regions are expected to grow at higher rates, factors affecting the market, and key opportunity areas, which will drive the industry and market growth through the forecast period. The report also includes the competitive landscape of key players in the industry along with their recent developments in the Global Tube Packaging market. The report studies factors such as company size, market share, market growth, revenue, production volume, and profits of the key players in the Global Tube Packaging market.
The report provides Porter's Five Force Model, which helps in designing the business strategies in the market. The report helps in identifying how many rivals are existing, who they are, and how their product quality is in the Global Tube Packaging market. The report also analyses if the Global Tube Packaging market is easy for a new player to gain a foothold in the market, do they enter or exit the market regularly if the market is dominated by a few players, etc.
The report also includes a PESTEL Analysis, which aids in the development of company strategies. Political variables help in figuring out how much a government can influence the Global Tube Packaging market. Economic variables aid in the analysis of economic performance drivers that have an impact on the Global Tube Packaging market. Understanding the impact of the surrounding environment and the influence of environmental concerns on the Global Tube Packaging market is aided by legal factors.
Tube Packaging Market Scope:
|
Tube Packaging Market |
|
|
Market Size in 2025 |
USD 15.59 Bn. |
|
Market Size in 2032 |
USD 25.45 Bn. |
|
CAGR (2026-2032) |
7.25% |
|
Historic Data |
2020-2025 |
|
Base Year |
2025 |
|
Forecast Period |
2026-2032 |
|
Segment Scope |
By Tube
|
|
By Product
|
|
|
By Application
|
|
|
Regional Scope |
North America- United States, Canada, and Mexico Europe – UK, France, Germany, Italy, Spain, Sweden, Austria, and Rest of Europe Asia Pacific – China, India, Japan, South Korea, Australia, ASEAN, Rest of APAC Middle East and Africa - South Africa, GCC, Egypt, Nigeria, Rest of the Middle East and Africa South America – Brazil, Argentina, Rest of South America |
Tube Packaging Market Key Players:
Frequently Asked Questions
North America region is expected to hold the highest share in the Tube Packaging Market.
The market size of the Tube Packaging Market by 2032 is expected to reach USD 25.45 Billion
The forecast period for the Tube Packaging Market is 2026-2032
The market size of the Tube Packaging Market in 2025 was valued at USD 15.59 Billion.
1. Research Methodology
1.1 Research Data
1.1.1. Primary Data
1.1.2. Secondary Data
1.2. Market Size Estimation
1.2.1. Bottom-Up Approach
1.2.2. Top-Up Approach
1.3. Market Breakdown and Data Triangulation
1.4. Research Assumption
2. Tube Packaging Market Executive Summary
2.1. Market Overview
2.2. Market Size (2025) and Forecast (2026-2032) and Y-O-Y%
2.3. Market Size (USD) and Market Share (%) – By Segments and Regions
3. Global Tube Packaging Market: Competitive Landscape
3.1. SMR Competition Matrix
3.2. Key Players Benchmarking
3.2.1. Company Name
3.2.2. Headquarter
3.2.3. Product Segment
3.2.4. End-user Segment
3.2.5. Y-O-Y%
3.2.6. Revenue (2025)
3.2.7. Profit Margin
3.2.8. Market Share
3.2.9. Company Locations
3.3. Market Structure
3.3.1. Market Leaders
3.3.2. Market Followers
3.3.3. Emerging Players
3.4. Consolidation of the Market
3.4.1. Strategic Initiatives and Developments
3.4.2. Mergers and Acquisitions
3.4.3. Collaborations and Partnerships
3.4.4. Product Launches and Innovations
4. Tube Packaging Market: Dynamics
4.1. Tube Packaging Market Trends by Region
4.1.1. North America
4.1.2. Europe
4.1.3. Asia Pacific
4.1.4. Middle East and Africa
4.1.5. South America
4.2. Tube Packaging Market Drivers
4.3. Tube Packaging Market Restraints
4.4. Tube Packaging Market Opportunities
4.5. Tube Packaging Market Challenges
4.6. PORTER’s Five Forces Analysis
4.6.1. Intensity of the Rivalry
4.6.2. Threat of New Entrants
4.6.3. Bargaining Power of Suppliers
4.6.4. Bargaining Power of Buyers
4.6.5. Threat of Substitutes
4.7. PESTLE Analysis
4.7.1. Political Factors
4.7.2. Economic Factors
4.7.3. Social Factors
4.7.4. Legal Factors
4.7.5. Environmental Factors
4.8. Technological Roadmap
4.9. Value Chain Analysis and Supply Chain Analysis
4.10. Regulatory Landscape
4.10.1. Market Regulation by Region
4.10.1.1. North America
4.10.1.2. Europe
4.10.1.3. Asia Pacific
4.10.1.4. Middle East and Africa
4.10.1.5. South America
4.10.2. Impact of Regulations on Market Dynamics
4.10.3. Government Schemes and Initiatives
5. Tube Packaging Market: Global Market Size and Forecast by Segmentation (by Value in USD Million) (2025-2032)
5.1. Tube Packaging Market Size and Forecast, by Tube (2025-2032)
5.1.1. Squeeze and Collapsible
5.1.2. Twist
5.2. Tube Packaging Market Size and Forecast, by Product (2025-2032)
5.2.1. Laminated
5.2.2. Aluminum
5.2.3. Plastic
5.3. Tube Packaging Market Size and Forecast, by Application (2025-2032)
5.3.1. Personal Care & Oral Care
5.3.2. Healthcare
5.3.3. Food
5.3.4. Consumer Goods
5.3.5. Others
5.4. Tube Packaging Market Size and Forecast, by Region (2025-2032)
5.4.1. North America
5.4.2. Europe
5.4.3. Asia Pacific
5.4.4. Middle East and Africa
5.4.5. South America
6. North America Tube Packaging Market Size and Forecast by Segmentation (by Value in USD Million) (2025-2032)
6.1. North America Tube Packaging Market Size and Forecast, by Tube (2025-2032)
6.1.1. Squeeze and Collapsible
6.1.2. Twist
6.2. North America Tube Packaging Market Size and Forecast, by Product (2025-2032)
6.2.1. Laminated
6.2.2. Aluminum
6.2.3. Plastic
6.3. North America Tube Packaging Market Size and Forecast, by Application (2025-2032)
6.3.1. Personal Care & Oral Care
6.3.2. Healthcare
6.3.3. Food
6.3.4. Consumer Goods
6.3.5. Others
6.4. North America Tube Packaging Market Size and Forecast, by Country (2025-2032)
6.4.1. United States
6.4.2. Canada
6.4.3. Mexico
7. Europe Tube Packaging Market Size and Forecast by Segmentation (by Value in USD Million) (2025-2032)
7.1. Europe Tube Packaging Market Size and Forecast, by Tube (2025-2032)
7.2. Europe Tube Packaging Market Size and Forecast, by Product (2025-2032)
7.3. Europe Tube Packaging Market Size and Forecast, by Application (2025-2032)
7.4. Europe Tube Packaging Market Size and Forecast, by Country (2025-2032)
7.4.1. United Kingdom
7.4.2. France
7.4.3. Germany
7.4.4. Italy
7.4.5. Spain
7.4.6. Sweden
7.4.7. Austria
7.4.8. Rest of Europe
8. Asia Pacific Tube Packaging Market Size and Forecast by Segmentation (by Value in USD Million) (2025-2032)
8.1. Asia Pacific Tube Packaging Market Size and Forecast, by Tube (2025-2032)
8.2. Asia Pacific Tube Packaging Market Size and Forecast, by Product (2025-2032)
8.3. Asia Pacific Tube Packaging Market Size and Forecast, by Application (2025-2032)
8.4. Asia Pacific Tube Packaging Market Size and Forecast, by Country (2025-2032)
8.4.1. China
8.4.2. S Korea
8.4.3. Japan
8.4.4. India
8.4.5. Australia
8.4.6. Indonesia
8.4.7. Malaysia
8.4.8. Vietnam
8.4.9. Taiwan
8.4.10. Rest of Asia Pacific
9. Middle East and Africa Tube Packaging Market Size and Forecast by Segmentation (by Value in USD Million) (2025-2032)
9.1. Middle East and Africa Tube Packaging Market Size and Forecast, by Tube (2025-2032)
9.2. Middle East and Africa Tube Packaging Market Size and Forecast, by Product (2025-2032)
9.3. Middle East and Africa Tube Packaging Market Size and Forecast, by Application (2025-2032)
9.4. Middle East and Africa Tube Packaging Market Size and Forecast, by Country (2025-2032)
9.4.1. South Africa
9.4.2. GCC
9.4.3. Nigeria
9.4.4. Rest of ME&A
10. South America Tube Packaging Market Size and Forecast by Segmentation (by Value in USD Million) (2025-2032)
10.1. South America Tube Packaging Market Size and Forecast, by Tube (2025-2032)
10.2. South America Tube Packaging Market Size and Forecast, by Product (2025-2032)
10.3. South America Tube Packaging Market Size and Forecast, by Application (2025-2032)
10.4. South America Tube Packaging Market Size and Forecast, by Country (2025-2032)
10.4.1. Brazil
10.4.2. Argentina
10.4.3. Rest Of South America
11. Company Profile: Key Players
11.1. Essel-Propack
11.1.1. Company Overview
11.1.2. Business Portfolio
11.1.3. Financial Overview
11.1.3.1. Total Revenue
11.1.3.2. Segment Revenue
11.1.3.3. Regional Revenue
11.1.4. SWOT Analysis
11.1.5. Strategic Analysis
11.1.6. Recent Developments
11.2. Albea
11.3. SUNA
11.4. Rego
11.5. Berry
11.6. Kimpai
11.7. BeautyStar
11.8. Kyodo Printing
11.9. Abdos
11.10. Toppan
11.11. Noe Pac
11.12. DNP
11.13. Montebello
11.14. Bell Packaging Group
11.15. LeanGroup
11.16. IntraPac
11.17. Scandolara
(* Key Players List Not Exhaustive)
12. Key Findings
13. Analyst Recommendations
13.1. Strategic Recommendations
13.2. Future Outlook