Oyster and Clam Market Global Industry Analysis and Forecast (2026-2032)
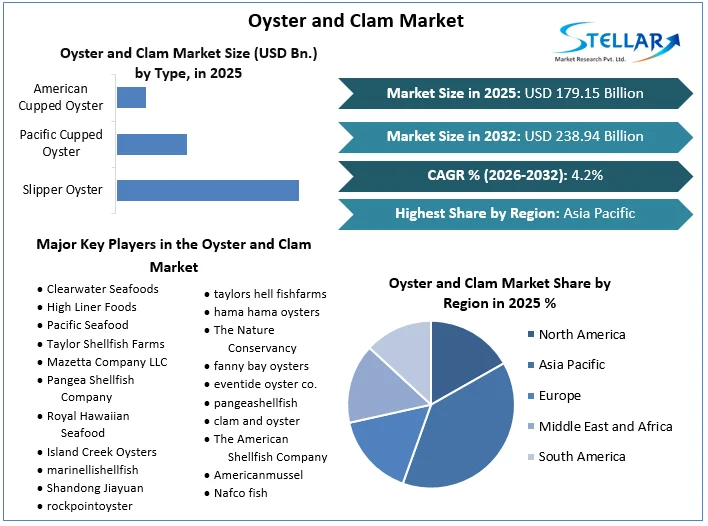
The Oyster and Clam Market size was valued at USD 179.15 Bn. in 2025 and the total Global Oyster and Clam revenue is expected to grow at a CAGR of 4.2% from 2026 to 2032, reaching nearly USD 238.94 Bn. by 2032.
Oyster and Clam Market Overview
The comprehensive SMR report offers an in-depth analysis of the global oyster and clam market, focusing on key trends, revenue/sales figures, and profitability metrics. It evaluates industry dynamics, encompassing market volatility, barriers to entry, and the industry life cycle stage. By researching profit margin analysis, stakeholders gain valuable insights into the financial performance and competitive positioning of key players across different regions and market segments. Additionally, a thorough analysis of Industry trends reveals new trends, customer preferences, and technology developments, which successfully directs strategic decision-making and market positioning tactics.
The research provides valuable insights into the labor dynamics in the oyster and clam sector by analyzing salary trends and employee demographics. The study provides essential data for strategic decision-making operational effectiveness, and overall profitability. In addition, a thorough profit analysis explores important clues to identify the factors and obstacles influencing profitability in diverse market sectors and geographical areas. Evaluating Oyster and Clam market volatility factors such as price swings and regulatory modifications offers insightful information about the stability of the industry and influences risk-reduction techniques.
The report meticulously identifies and analyses market barriers to entry, including regulatory requirements, capital investment, and technological obstacles. These insights illuminate challenges and opportunities for new entrants seeking to penetrate the oyster and clam market. The Report provides profiles of leading players, brands, and manufacturers, offering valuable insights into their competitive strategies, market share, and product portfolios.
Also, the SMR report covers the analysis of market concentration and consolidation trends and exposes the competitive landscape's structure, revealing potential merger and acquisition opportunities and dynamics of market dominance. The identification of market leaders and industry statistics serves as a benchmark for evaluating performance and conducting competitive benchmarking within the oyster and clam market.
To get more Insights: Request Free Sample Report
Oyster and Clam Market Dynamics
Seafood Increases: Global Trends Driving Demand for Oysters and Clams
The global consumption of seafood, including oysters and clams, continues to rise due to population growth, urbanization, and changing dietary habits. Emerging Oyster and Clam markets in Asia-Pacific, particularly China, exhibit significant demand for shellfish, driving international trade and Oyster and Clam market growth. Foods high in protein, such as seafood, are in greater demand as the world's population grows. A greater number of individuals are moving to cities as a result of urbanization, where there are more and more culinary options available, including shellfish.
Concurrently, consumers' nutritional choices are shifting in favor of healthier protein sources, such as seafood. Valued for their high proportion of lean protein, vitamins, and critical minerals, oysters and clams fit in wonderfully with these changing eating habits. The growing demand and popularity of oysters and clams in international markets is driven by the trifecta of population increase, urbanization, and changing dietary trends.
Seizing Growth Opportunities in the Oyster and Clam Market
The food versatility of oysters and clams presents an evolving environment with opportunities in Oyster and Clam market growth. Embracing specific culinary trends is key to capitalizing on these opportunities and staying ahead in the dynamic marketplace. Premium oyster and clam types, each with unique flavors and textures, are becoming increasingly in demand as higher seafood dining develops growing in popularity. Producers can capitalize on the current situation by raising particular breeds that are suited to the tastes of discriminating buyers. Accepting these gastronomic fads not only enables manufacturers to set themselves apart from competitors but also opens doors to new markets. Producers can access unexplored markets by going beyond conventional applications, helping to drive growth in revenue and Oyster and Clam market growth.
Navigating Environmental Challenges and its impact on the market
Overfishing diminishes wild oyster and clam stocks, reducing the raw material supply and compromising product quantity and quality. Additionally, massive harvesting disrupts marine ecosystems, risking biodiversity loss and compromising the natural reproduction of oysters and clams, which further impacts environmental health. The SMR Report discusses how the oyster and clam industry's price volatility is impacted by decreased wild supplies. Such volatility threatens market stability and reduces industry profit margins. In addition, a shortage of raw materials is expected to cause supply chain disruptions, which makes it more difficult for businesses to meet consumer demand and result in revenue losses. Also, stringent regulatory measures imposed by governments to promote sustainability escalate operational expenses for producers and restrict access to specific wild-caught resources, further complicating market dynamics.
Oyster and Clam Market Segment Analysis
By Type, the Slipper oysters segment dominates the global Oyster and Clam market share with XX% in 2025, favored for their delicate taste and association with raw consumption, particularly in high-end restaurants and among discerning consumers. Their premium positioning allows for potentially higher profit margins, as they can command premium prices to target consumers seeking a unique dining experience. However, considerations affecting profitability include potentially higher production costs due to specialized handling techniques and packaging requirements for freshness.
Additionally, the market concentration for premium oysters limits competition, impacting profit margins for producers lacking economies of scale in production or distribution. Because industry records frequently lack thorough breakdowns, it is occasionally difficult to obtain particular profit margin data for slipper oysters relative to other types because of data constraints. Despite this, examining revenue/sales patterns provides information, especially for the premium seafood market segment where slipper oysters have room to grow. Also, price volatility is expected to be greater for premium kinds such as slipper oysters because they rely on particular market conditions and consumer preferences. Even with limited data, these trends offer useful insights into the dynamics of the industry and prospects for slipper oyster growers.
Oyster and Clam Market Regional Analysis
The Asia Pacific region serves as a key hub for oyster and clam consumption and production, exerting a substantial influence on global Oyster and Clam market growth with XX% of market share. The growth is driven by population growth, urbanization, and a preference for nutritious protein sources. As a result, significant prospects arise for regional farmers and distributors, underscoring Asia Pacific's importance in driving the oyster and clam market's rising trajectory. With wild stocks under strain, China and Vietnam are directing efforts toward sustainable aquaculture practices for oyster and clam farming.
The strategic change ensures a consistent supply to fulfill rising demand. Also, culinary trends and consumer preferences for convenience are sparking product innovation. Pre-shucked, flavored, and ready-to-eat varieties are witnessing heightened interest, diversifying the market's product offerings. As aquaculture gains prominence and consumer tastes evolve, the oyster and clam industry adapts, aligning with sustainability goals and providing to the growing demand for convenient and flavourful seafood options.
Raw material costs in the oyster and clam industry fluctuate based on factors such as species, farming techniques (aquaculture vs. wild-caught), and geographic location. Generally, wild-caught varieties command higher prices compared to farm-raised counterparts. Labor expenses fluctuate across Asia-Pacific countries, with developed economies like Japan typically incurring higher wages than emerging economies like Vietnam. Additionally, service costs for processing, packaging, transportation, and distribution vary based on selected methods and value-added services provided, such as shucking and pre-cooking. These cost dynamics impact on the overall production of expenses and pricing strategies within the oyster and clam market.
Oyster and Clam Market Competitive Landscape
Product innovation in the oyster and clam market provides diverse consumer preferences through offerings like pre-marinated, ready-to-cook options, and value-added kits for convenient home cooking. Additionally, frozen varieties provide convenience it increase the Oyster and Clam market demand. Sustainability initiatives are gaining traction, with launches underscoring eco-friendly packaging and responsible sourcing to attract environmentally conscious consumers and bolster brand reputation. Direct-to-consumer (D2C) models offer farm-to-table, subscription-based delivery, bypassing traditional channels.
- Matunuck Oyster Bar announced on April 12, 2023, that it was increasing its aquaculture operations in Potter Pond and that a larger project, worth $2.4 million, was in the works. The new hatchery and research center for shellfish will be situated close to the restaurant, which is highly regarded.
- In December 2021, Island Seafood introduced a web service portal. The online platform enables customers to conveniently order packages of 10, 20, or 50 oysters for delivery throughout Canada. In addition, the company has introduced an enticing promotional party package. This package includes complementary items such as a shucking knife, beer, charcuterie, and a curated music playlist. These offerings stimulate demand for the company’s oyster products and services by providing customers with a comprehensive and enjoyable experience.
|
Oyster and Clam Market Scope |
|
|
Market Size in 2025 |
USD 179.15 Bn. |
|
Market Size in 2032 |
USD 238.94 Bn. |
|
CAGR (2026-2032) |
4.2% |
|
Historic Data |
2020-2025 |
|
Base Year |
2025 |
|
Forecast Period |
2026-2032 |
|
Segment Scope |
By Type Slipper Oyster Pacific Cupped Oyster American Cupped Oyster |
|
By Clam Type Hard Clam Taca Clam Stimpson Surf Atlantic Surf |
|
|
|
By Form Fresh Canned |
|
Regional Scope |
North America- United States, Canada, and Mexico Europe – UK, France, Germany, Italy, Spain, Sweden, Austria, and Rest of Europe Asia Pacific – China, India, Japan, South Korea, Australia, ASEAN, Rest of APAC Middle East and Africa - South Africa, GCC, Egypt, Nigeria, Rest of the Middle East and Africa South America – Brazil, Argentina, Rest of South America |
Key Player in the Oyster and Clam Market
- Clearwater Seafoods
- High Liner Foods
- Pacific Seafood
- Taylor Shellfish Farms
- Mazetta Company LLC
- Pangea Shellfish Company
- Royal Hawaiian Seafood
- Island Creek Oysters
- marinellishellfish
- Shandong Jiayuan
- rockpointoyster
- taylors hell fishfarms
- hama hama oysters
- The Nature Conservancy
- fanny bay oysters
- eventide oyster co.
- pangeashellfish
- clam and oyster
- The American Shellfish Company
- Americanmussel
- Nafco fish
- Hog islan doysters
Frequently Asked Questions
An analysis of profit trends and projections for companies in the oyster and clam market is included, offering insights into factors driving profitability, cost management strategies, and financial performance metrics.
The report identifies and analyzes market barriers to entry, including regulatory requirements, capital investments, technological barriers, and competitive challenges. Understanding these barriers is essential for new entrants and existing players to navigate the market landscape effectively.
The Market size was valued at USD 179.15 Billion in 2025 and the total Market revenue is expected to grow at a CAGR of 4.2% from 2026 to 2032, reaching nearly USD 238.94 billion.
The segments covered in the market report are By Type, Clam Type, and Form.
1. Research Methodology
1.1 Research Data
1.1.1. Primary Data
1.1.2. Secondary Data
1.2. Market Size Estimation
1.2.1. Bottom-Up Approach
1.2.2. Top-Down Approach
1.3. Market Breakdown and Data Triangulation
1.4. Research Assumption
2. Oyster and Clam Market Executive Summary
2.1. Market Overview
2.2. Market Size (2025) and Forecast (2026– 2032) and Y-O-Y%
2.3. Market Size (USD) and Market Share (%) – By Segments and Regions
3. Global Oyster and Clam Market: Competitive Landscape
3.1. SMR Competition Matrix
3.2. Key Players Benchmarking
3.2.1. Company Name
3.2.2. Headquarter
3.2.3. Product Segment
3.2.4. End-user Segment
3.2.5. Y-O-Y%
3.2.6. Revenue (2025)
3.2.7. Profit Margin
3.2.8. Market Share
3.2.9. Company Locations
3.3. Market Structure
3.3.1. Market Leaders
3.3.2. Market Followers
3.3.3. Emerging Players
3.4. Consolidation of the Market
3.4.1. Strategic Initiatives and Developments
3.4.2. Mergers and Acquisitions
3.4.3. Collaborations and Partnerships
4. Oyster and Clam Market: Dynamics
4.1. Oyster and Clam Market Trends by Region
4.1.1. North America
4.1.2. Europe
4.1.3. Asia Pacific
4.1.4. Middle East and Africa
4.1.5. South America
4.2. Oyster and Clam Market Drivers
4.3. Oyster and Clam Market Restraints
4.4. Oyster and Clam Market Opportunities
4.5. Oyster and Clam Market Challenges
4.6. PORTER’s Five Forces Analysis
4.6.1. Intensity of the Rivalry
4.6.2. Threat of New Entrants
4.6.3. Bargaining Power of Suppliers
4.6.4. Bargaining Power of Buyers
4.6.5. Threat of Substitutes
4.7. PESTLE Analysis
4.7.1. Political Factors
4.7.2. Economic Factors
4.7.3. Social Factors
4.7.4. Technological Factor
4.7.5. Legal Factors
4.7.6. Environmental Factors
4.8. Technological Roadmap
4.9. Value Chain Analysis
4.10. Regulatory Landscape by Region
4.10.1. North America
4.10.2. Europe
4.10.3. Asia Pacific
4.10.4. Middle East and Africa
4.10.5. South America
5. Oyster and Clam Market: Global Market Size and Forecast by Segmentation (by Value in USD Million and Volume in Tons) (2025-2032)
5.1. Oyster and Clam Market Size and Forecast, by Type (2025-2032)
5.1.1. Slipper Oyster
5.1.2. Pacific Cupped Oyster
5.1.3. American Cupped Oyster
5.2. Oyster and Clam Market Size and Forecast, by Clam Type (2025-2032)
5.2.1. Hard Clam
5.2.2. Taca Clam
5.2.3. Stimpson Surf
5.2.4. Atlantic Surf
5.3. Oyster and Clam Market Size and Forecast, by Form (2025-2032)
5.3.1. Fresh
5.3.2. Canned
5.4. Oyster and Clam Market Size and Forecast, by Region (2025-2032)
5.4.1. North America
5.4.2. Europe
5.4.3. Asia Pacific
5.4.4. Middle East and Africa
5.4.5. South America
6. North America Oyster and Clam Market Size and Forecast by Segmentation (by Value in USD Million and Volume in Tons) (2025-2032)
6.1. North America Oyster and Clam Market Size and Forecast, by Type (2025-2032)
6.1.1. Slipper Oyster
6.1.2. Pacific Cupped Oyster
6.1.3. American Cupped Oyster
6.2. North America Oyster and Clam Market Size and Forecast, by Clam Type (2025-2032)
6.2.1. Hard Clam
6.2.2. Taca Clam
6.2.3. Stimpson Surf
6.2.4. Atlantic Surf
6.3. North America Oyster and Clam Market Size and Forecast, by Form (2025-2032)
6.3.1. Fresh
6.3.2. Canned
6.4. North America Oyster and Clam Market Size and Forecast, by Country (2025-2032)
6.4.1. United States
6.4.2. Canada
6.4.3. Mexico
7. Europe Oyster and Clam Market Size and Forecast by Segmentation (by Value in USD Million and Volume in Tons) (2025-2032)
7.1. Europe Oyster and Clam Market Size and Forecast, by Type (2025-2032)
7.2. Europe Oyster and Clam Market Size and Forecast, by Clam Type (2025-2032)
7.3. Europe Oyster and Clam Market Size and Forecast, by Form (2025-2032)
7.4. Europe Oyster and Clam Market Size and Forecast, by Country (2025-2032)
7.4.1. United Kingdom
7.4.2. France
7.4.3. Germany
7.4.4. Italy
7.4.5. Spain
7.4.6. Sweden
7.4.7. Austria
7.4.8. Rest of Europe
8. Asia Pacific Oyster and Clam Market Size and Forecast by Segmentation (by Value in USD Million and Volume in Tons) (2025-2032)
8.1. Asia Pacific Oyster and Clam Market Size and Forecast, by Type (2025-2032)
8.2. Asia Pacific Oyster and Clam Market Size and Forecast, by Clam Type (2025-2032)
8.3. Asia Pacific Oyster and Clam Market Size and Forecast, by Form (2025-2032)
8.4. Asia Pacific Oyster and Clam Market Size and Forecast, by Country (2025-2032)
8.4.1. China
8.4.2. S Korea
8.4.3. Japan
8.4.4. India
8.4.5. Australia
8.4.6. Indonesia
8.4.7. Malaysia
8.4.8. Vietnam
8.4.9. Taiwan
8.4.10. Rest of Asia Pacific
9. Middle East and Africa Oyster and Clam Market Size and Forecast by Segmentation (by Value in USD Million and Volume in Tons) (2025-2032)
9.1. Middle East and Africa Oyster and Clam Market Size and Forecast, by Type (2025-2032)
9.2. Middle East and Africa Oyster and Clam Market Size and Forecast, by Clam Type (2025-2032)
9.3. Middle East and Africa Oyster and Clam Market Size and Forecast, by Form (2025-2032)
9.4. Middle East and Africa Oyster and Clam Market Size and Forecast, by Country (2025-2032)
9.4.1. South Africa
9.4.2. GCC
9.4.3. Nigeria
9.4.4. Rest of ME&A
10. South America Oyster and Clam Market Size and Forecast by Segmentation (by Value in USD Million and Volume in Tons) (2025-2032)
10.1. South America Oyster and Clam Market Size and Forecast, by Type (2025-2032)
10.2. South America Oyster and Clam Market Size and Forecast, by Clam Type (2025-2032)
10.3. South America Oyster and Clam Market Size and Forecast, by Form (2025-2032)
10.4. South America Oyster and Clam Market Size and Forecast, by Country (2025-2032)
10.4.1. Brazil
10.4.2. Argentina
10.4.3. Rest Of South America
11. Company Profile: Key Players
11.1. Clearwater Seafoods
11.1.1. Company Overview
11.1.2. Business Portfolio
11.1.2.1. Product Name
11.1.2.2. Product Details (Price, Features, etc.)
11.1.3. Financial Overview
11.1.3.1. Total Revenue
11.1.3.2. Segment Revenue
11.1.3.3. Regional Revenue
11.1.4. SWOT Analysis
11.1.5. Strategic Analysis
11.1.6. Recent Developments
11.2. High Liner Foods
11.3. Pacific Seafood
11.4. Taylor Shellfish Farms
11.5. Mazetta Company LLC
11.6. Pangea Shellfish Company
11.7. Royal Hawaiian Seafood
11.8. Island Creek Oysters
11.9. marinellishellfish
11.10. Shandong Jiayuan
11.11. rockpointoyster
11.12. taylors hell fishfarms
11.13. hama hama oysters
11.14. The Nature Conservancy
11.15. fanny bay oysters
11.16. eventide oyster co.
11.17. pangeashellfish
11.18. clam and oyster
11.19. The American Shellfish Company
11.20. Americanmussel
11.21. Nafco fish
11.22. Hog islan doysters
12. Key Findings
13. Analyst Recommendations
13.1. Strategic Recommendations
13.2. Future Outlook


