Leather Goods Market Global Outlook and Forecast (2026-2032) Trends, Statistics, Dynamics, Segmentation by Product, Type, and Region
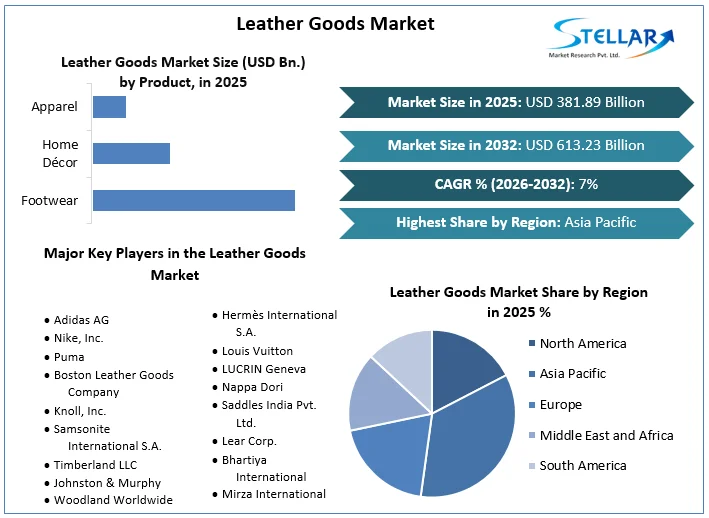
The Leather Goods Market size was valued at USD 381.89 Billion in 2025 and the total Leather Goods revenue is expected to grow at a CAGR of 7% from 2026 to 2032, reaching nearly USD 613.23 Billion.
Leather Goods Market Definition:
A product made of leather is leather goods. They are made out of material from tanning hides and the skin of animals, mainly from cattle. Leather luggage contains suitcases, trolley bags, etc. used for carrying personal belongings and products containing purses, wallets & belts, footwear, handbags, and others.
To get more Insights: Request Free Sample Report
Leather Goods Market Dynamics:
At fashion exhibitions and events across the world, designers from all over the world show off their latest creations, bringing more customers to leatherwear. The show featured modern jackets, twill trench coats, travel bags, leather shoes, duffle bags, and ankle boots, among other leather goods. Hundreds of thousands of leather goods customers, manufacturers, and designers from various provinces attend these events.
Demand for leather items is being driven by an increase in the number of High Net Worth individuals, as well as the growing trend of designer and designer clothing in major markets such as the United States, France, and China. Leather goods are rare and often more expensive. Because of the expanding number of HNWIs in China, there is a significant demand for leather goods.
The increased awareness of the negative consequences of unethical clothes and footwear manufacturing processes has boosted the demand for sustainable items. Consumers are drawn to sustainable fashion because many well-known designers support the notion.
The growth of numerous businesses has been fueled by the increase in local and worldwide travel. People carry leather baggage bags that are easy to handle. Long excursions necessitate leather luggage that can tolerate constant abuse. As a result, for ease of mobility, buyers choose premium and higher-quality leather baggage.
Leather fashion accessories are leather products that are used with or as a complement to other clothing. They usually have both a utilitarian and a decorative significance. Leather accessories, like clothing and non-leather fashion accessories, have a longer life cycle, especially when it comes to high-end products that gain value with time. Carrying products, gloves and mitts, belts, and other accessories are among the fastest-growing areas of leather fashion accessories. Consumer demand for leather handbags and wallets was boosted by the growing fashion industry, driving the global accessories market forward. Customers are increasingly concerned with aesthetics, and the demand for high-end goods as a fashion statement has increased. Manufacturers of leather-based accessories include Gucci, Gianni Versace, and Louis Vuitton, all of which are based in Europe.
Leather Goods Market Segment Analysis:
By Product, Footwear dominated the market in 2025, with a 43 % share. Major players such as Nike, Adidas, and others have entered the leather athletic footwear market, as have new entrants. The factors driving the growth of the footwear industry include a wide choice of design, sizes, customizations, and expanding sneaker styles, among others.
Through the forecast period, apparel is expected to increase at a CAGR of 7.32 %. The rise in disposable income and the availability of a wide range of shapes and styles are projected to fuel market expansion throughout the forecast period.
By Type, in 2025, the genuine segment dominated the market with a 58 % share. Factors fueling demand for the product include the fact that it is less expensive than genuine leather products and that it is similarly attractive in terms of style. Polyurethane and polyvinyl chloride are used to make it. When compared to vinyl, polyurethane is environmentally beneficial because it does not emit dioxins.

Through the forecast period, the synthetic segment is expected to increase at a CAGR of 6.8 %. Low cost and heavy-duty construction, as well as environmentally friendly choices, are likely to encourage demand for the product. Heavy-duty, flexible, and with a medium wall construction that flexes but stays crack-resistant, products made from materials such as PET are available.
Leather Goods Market Regional Insights:
The Asia Pacific dominated the market with 36 % in 2025. Increasing demand for premium and luxury products are the factors driving the demand for the product. Bangladesh and Pakistan are important sources for primary leather in Asia. Significantly low tariff rates on exported leather products make Bangladesh an eye-catching market for overseas leather goods brands.
Europe is expected to grow at a CAGR of 6 % through the forecast period. Some of the primary drivers driving the growth of the European market include the strong presence of local and international companies, product and technology breakthroughs, the rise in online commerce, and the use of social media platforms. Luggage and leather products sales in the region are driven by expanding fashion consciousness, rising disposable incomes, and rising demand for attractive bags. Furthermore, as consumers become more interested in travel and unusual experiences, demand for leather products, such as luggage bags, is expanding, particularly in the luxury market, as buyers seek out high-quality things. Furthermore, because of the high presence of fashion-driven countries such as France and Italy, the area continues to be the market's largest consumer.
Leather Goods Market Key Players Insights:
The market is characterized by the existence of a number of well-known firms. These companies control a large portion of the market, have a wide product portfolio, and have a global presence. In addition, the market comprises small to mid-sized competitors that sell a limited variety of items, some of which are self-publishing organizations.
The market's major companies have a significant impact because most of them have extensive global networks through which they can reach their massive client bases. To drive revenue growth and strengthen their positions in the global market, key players in the market, particularly in Europe and North America, are focusing on strategic initiatives such as acquisitions, new collection launches, and partnerships.
The objective of the report is to present a comprehensive analysis of the Global Leather Goods market to the stakeholders in the industry. The report provides trends that are most dominant in the Global Leather Goods market and how these trends will influence new business investments and market development throughout the forecast period. The report also aids in the comprehension of the Global Leather Goods Market dynamics and competitive structure of the market by analyzing market leaders, market followers, and regional players.
The qualitative and quantitative data provided in the Global Leather Goods market report is to help understand which market segments, regions are expected to grow at higher rates, factors affecting the market, and key opportunity areas, which will drive the industry and market growth through the forecast period. The report also includes the competitive landscape of key players in the industry along with their recent developments in the Global Leather Goods market. The report studies factors such as company size, market share, market growth, revenue, production volume, and profits of the key players in the Global Leather Goods market.
The report provides Porter's Five Force Model, which helps in designing the business strategies in the market. The report helps in identifying how many rivals are existing, who they are, and how their product quality is in the Global Leather Goods market. The report also analyses if the Global Leather Goods market is easy for a new player to gain a foothold in the market, do they enter or exit the market regularly if the market is dominated by a few players, etc.
The report also includes a PESTEL Analysis, which aids in the development of company strategies. Political variables help in figuring out how much a government can influence the Global Leather Goods market. Economic variables aid in the analysis of economic performance drivers that have an impact on the Global Leather Goods market. Understanding the impact of the surrounding environment and the influence of environmental concerns on the Global Leather Goods market is aided by legal factors.
Leather Goods Market Scope:
|
Leather Goods Market Scope |
|
|
Market Size in 2025 |
USD 381.89 Bn. |
|
Market Size in 2032 |
USD 613.23 Bn. |
|
CAGR (2026-2032) |
7% |
|
Historic Data |
2020-2025 |
|
Base Year |
2025 |
|
Forecast Period |
2026-2032 |
|
Segment Scope |
By Product
|
|
By Type
|
|
|
Regional Scope |
North America- United States, Canada, and Mexico Europe – UK, France, Germany, Italy, Spain, Sweden, Austria, and Rest of Europe Asia Pacific – China, India, Japan, South Korea, Australia, ASEAN, Rest of APAC Middle East and Africa - South Africa, GCC, Egypt, Nigeria, Rest of the Middle East and Africa South America – Brazil, Argentina, Rest of South America |
Leather Goods Market Key Players:
- Adidas AG
- Nike, Inc.
- Puma
- Boston Leather Goods Company
- Knoll, Inc.
- Samsonite International S.A.
- Timberland LLC
- Johnston & Murphy
- Woodland Worldwide
- Hermès International S.A.
- Louis Vuitton
- LUCRIN Geneva
- Nappa Dori
- Saddles India Pvt. Ltd.
- Lear Corp.
- Bhartiya International
- Mirza International
Frequently Asked Questions
Asia Pacific region is expected to hold the highest share in the Leather Goods Market.
The market size of the Leather Goods Market by 2032 is expected to reach USD 613.23 Billion
The forecast period for the Leather Goods Market is 2026-2032.
The market size of the Leather Goods Market in 2025 was valued at USD 381.89 Billion.
1. Research Methodology
1.1 Research Data
1.1.1. Primary Data
1.1.2. Secondary Data
1.2. Market Size Estimation
1.2.1. Bottom-Up Approach
1.2.2. Top-Up Approach
1.3. Market Breakdown and Data Triangulation
1.4. Research Assumption
2. Leather Goods Market Executive Summary
2.1. Market Overview
2.2. Market Size (2025) and Forecast (2026– 2032) and Y-O-Y%
2.3. Market Size (USD) and Market Share (%) – By Segments and Regions
3. Global Leather Goods Market: Competitive Landscape
3.1. SMR Competition Matrix
3.2. Key Players Benchmarking
3.2.1. Company Name
3.2.2. Headquarter
3.2.3. Product Segment
3.2.4. End-user Segment
3.2.5. Y-O-Y%
3.2.6. Revenue (2025)
3.2.7. Profit Magin
3.2.8. Market Share
3.2.9. Company Locations
3.3. Market Structure
3.3.1. Market Leaders
3.3.2. Market Followers
3.3.3. Emerging Players
3.4. Consolidation of the Market
3.4.1. Strategic Initiatives and Developments
3.4.2. Mergers and Acquisitions
3.4.3. Collaborations and Partnerships
3.4.4. Product Launches and Innovations
4. Leather Goods Market: Dynamics
4.1. Leather Goods Market Trends by Region
4.1.1. North America
4.1.2. Europe
4.1.3. Asia Pacific
4.1.4. Middle East and Africa
4.1.5. South America
4.2. Leather Goods Market Drivers
4.3. Leather Goods Market Restraints
4.4. Leather Goods Market Opportunities
4.5. Leather Goods Market Challenges
4.6. PORTER’s Five Forces Analysis
4.6.1. Intensity of the Rivalry
4.6.2. Threat of New Entrants
4.6.3. Bargaining Power of Suppliers
4.6.4. Bargaining Power of Buyers
4.6.5. Threat of Substitutes
4.7. PESTLE Analysis
4.7.1. Political Factors
4.7.2. Economic Factors
4.7.3. Social Factors
4.7.4. Legal Factors
4.7.5. Environmental Factors
4.8. Technological Roadmap
4.9. Value Chain Analysis and Supply Chain Analysis
4.10. Regulatory Landscape
4.10.1. Market Regulation by Region
4.10.1.1. North America
4.10.1.2. Europe
4.10.1.3. Asia Pacific
4.10.1.4. Middle East and Africa
4.10.1.5. South America
4.10.2. Impact of Regulations on Market Dynamics
4.10.3. Government Schemes and Initiatives
5. Leather Goods Market: Global Market Size and Forecast by Segmentation (by Value in USD Million) (2025-2032)
5.1. Leather Goods Market Size and Forecast, by Product (2025-2032)
5.1.1. Footwear
5.1.2. Home Décor
5.1.3. Apparel
5.2. Leather Goods Market Size and Forecast, by Type (2025-2032)
5.2.1. Genuine
5.2.2. Synthetic
5.3. Leather Goods Market Size and Forecast, by Region (2025-2032)
5.3.1. North America
5.3.2. Europe
5.3.3. Asia Pacific
5.3.4. Middle East and Africa
5.3.5. South America
6. North America Leather Goods Market Size and Forecast by Segmentation (by Value in USD Million) (2025-2032)
6.1. North America Leather Goods Market Size and Forecast, by Product (2025-2032)
6.1.1. Footwear
6.1.2. Home Décor
6.1.3. Apparel
6.2. North America Leather Goods Market Size and Forecast, by Type (2025-2032)
6.2.1. Genuine
6.2.2. Synthetic
6.3. North America Leather Goods Market Size and Forecast, by Country (2025-2032)
6.3.1. United States
6.3.2. Canada
6.3.3. Mexico
7. Europe Leather Goods Market Size and Forecast by Segmentation (by Value in USD Million) (2025-2032)
7.1. Europe Leather Goods Market Size and Forecast, by Product (2025-2032)
7.2. Europe Leather Goods Market Size and Forecast, by Type (2025-2032)
7.3. Europe Leather Goods Market Size and Forecast, by Country (2025-2032)
7.3.1. United Kingdom
7.3.2. France
7.3.3. Germany
7.3.4. Italy
7.3.5. Spain
7.3.6. Sweden
7.3.7. Austria
7.3.8. Rest of Europe
8. Asia Pacific Leather Goods Market Size and Forecast by Segmentation (by Value in USD Million) (2025-2032)
8.1. Asia Pacific Leather Goods Market Size and Forecast, by Product (2025-2032)
8.2. Asia Pacific Leather Goods Market Size and Forecast, by Type (2025-2032)
8.3. Asia Pacific Leather Goods Market Size and Forecast, by Country (2025-2032)
8.3.1. China
8.3.2. S Korea
8.3.3. Japan
8.3.4. India
8.3.5. Australia
8.3.6. Indonesia
8.3.7. Malaysia
8.3.8. Vietnam
8.3.9. Taiwan
8.3.10. Rest of Asia Pacific
9. Middle East and Africa Leather Goods Market Size and Forecast by Segmentation (by Value in USD Million) (2025-2032)
9.1. Middle East and Africa Leather Goods Market Size and Forecast, by Product (2025-2032)
9.2. Middle East and Africa Leather Goods Market Size and Forecast, by Type (2025-2032)
9.3. Middle East and Africa Leather Goods Market Size and Forecast, by Country (2025-2032)
9.3.1. South Africa
9.3.2. GCC
9.3.3. Nigeria
9.3.4. Rest of ME&A
10. South America Leather Goods Market Size and Forecast by Segmentation (by Value in USD Million) (2025-2032)
10.1. South America Leather Goods Market Size and Forecast, by Product (2025-2032)
10.2. South America Leather Goods Market Size and Forecast, by Type (2025-2032)
10.3. South America Leather Goods Market Size and Forecast, by Country (2025-2032)
10.3.1. Brazil
10.3.2. Argentina
10.3.3. Rest Of South America
11. Company Profile: Key Players
11.1. Adidas AG
11.1.1. Company Overview
11.1.2. Business Portfolio
11.1.2.1. Product Name
11.1.2.2. Product Details (Price, Features, etc)
11.1.3. Financial Overview
11.1.3.1. Total Revenue
11.1.3.2. Segment Revenue
11.1.3.3. Regional Revenue
11.1.4. SWOT Analysis
11.1.5. Strategic Analysis
11.1.6. Recent Developments
11.2. Nike, Inc.
11.3. Puma
11.4. Boston Leather Goods Company
11.5. Knoll, Inc.
11.6. Samsonite International S.A.
11.7. Timberland LLC
11.8. Johnston & Murphy
11.9. Woodland Worldwide
11.10. Hermès International S.A.
11.11. Louis Vuitton
11.12. LUCRIN Geneva
11.13. Nappa Dori
11.14. Saddles India Pvt. Ltd.
11.15. Lear Corp.
11.16. Bhartiya International
11.17. Mirza International
12. Key Findings
13. Analyst Recommendations
13.1. Strategic Recommendations
13.2. Future Outlook


