Laminated Labels Market: Global Market Outlook and Forecast (2024-2030) Trends, Statistics, Dynamics, Segmentation by Composition, Type, Form, and Region.

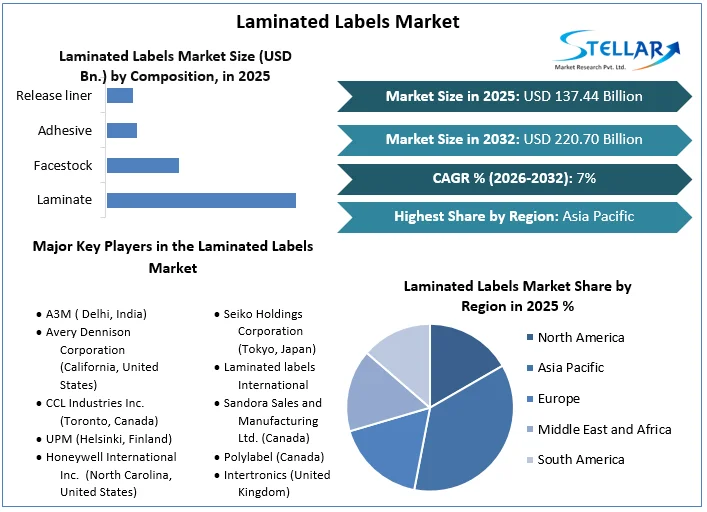
  • Laminated Labels Market was valued at USD 120.05 billion in 2023. Global Laminated Labels Market size is estimated to grow at a CAGR of 7% over the forecast period.

  • Format : PDF | Report ID : SMR_383

Laminated Labels Market Definition:

A protective coating on laminate labels improves their life by allowing them to survive harsh environments such as chemicals, dampness, and solvents. When high friction and weather resistance are important, laminated labels provide the best durability and lifespan. Laminated labels endure the harsh conditions that might cause physical damage to unlaminated objects, such as excessive temperatures and UV light. Product information such as the product name, address, market information, ingredients, QR code, barcode, and more are included on the laminated label. Topcoats, adhesives, face materials, liners, and substrates with labels are the primary components of laminated labels Furthermore, laminated labels protect printing and are more durable than coatings. The report on the Laminated Labels Market by Stellar Market Research is come up with the PESTLE, PORTER's five force and segment analysis on the basis of composition, type, form and region.


Laminated Labels Market


To get more Insights: Request Free Sample Report


Laminated Labels Market Dynamics:

One of the key factors driving the laminated labels market is the preference for semi-glossy or matte laminate finishes over glossy labels when scanning the barcode on the matte finish label.


Aesthetics and high performance with growing pressure-sensitive technology and the availability of other choices, such as printing directly on the container, along with the supplier's low switching costs are likely to boost bargaining leverage even further. Increased product demand comes from the food and beverage industry, and consumer goods demand, logistics, and manufacturing activity expansion are the key drivers of growth in the laminated labels market.


The introduction of nanotechnology in label and packaging applications has created a business opportunity. For invisible brand protection coding and smart indicator labels that signal temperature changes, spy dust or nanotags are utilised. Nanoscale particles can be disseminated directly into liquids and utilised as printing inks and coating materials, according to new procedures being developed by manufacturers.


The laminated labels market is also benefiting from the increased use of smart labels in RFID. RFID is used to track commodities across the supply chain, track parts on manufacturing lines, and implement cashless payment systems, among other applications.


In the packaging business, there are alternatives that can simply replace laminated labels. Flexible packaging and pouches are packaging products that do not require additional labels to be attached to the packaged item. These factors are restraining the laminated labels market growth.


Glossed labels can also be utilised to generate high-gloss finishes, which reduces the necessity for laminated labels. Laminated label producers' profit margins have shrunk due to fierce market rivalry. The big consumer business distributes its products at a low cost due to severe competition, resulting in minimal profit margins for label makers.


Adhesive labels are becoming more important in the industry as an advanced labelling technology. Label geometry, multi-process imaging, fast automatic and accurate output are all provided by pressure-sensitive technology, which is ideal for premium labelling applications. Pressure-sensitive technology is far superior to other technologies, especially in applications involving information labelling.


The rise of in-mold labelling in the label industry is driving the laminated labels market growth. In-mold labelling is a manufacturing technique that produces and labels the container at the same time, using high-speed injection moulding and blow moulding with robot assistance. The in-mold labelling approach is preferred by most brand owners since it is suitable for large volumes of containers and decreases the weight and expense of the packing process.


Laminated Labels Market Segment Analysis:

By Composition, Facestock dominated the laminated labels market with a 42.1 % share in 2023. It serves as a moisture and steam barrier as well as a protective laminate. It is commonly used as a spacer material for the layered construction and is placed on top of the laminated label.


Through the forecast period, the release liner segment is expected to grow at a CAGR of 6.2 %. Paper, coated paper, or silicone coated film can be used as the release film. It also aids in keeping the glue in place until the label is applied. These reasons are expected to fuel the segment's expansion in the market.


By Type, Polyester dominated the laminated labels market with 43.4 % in 2023. Durable labels with strong chemical and heat resistance are becoming increasingly popular. It has increased demand in numerous industries as a result of these qualities. These reasons are driving the segment demand.


The UV sunscreen polyester and UL-certified laminate segments are expected to expand rapidly. There is a growing demand for UV-resistant labels that are attractive and do not fade over time. Throughout the projection period, these factors are expected to drive the segment's growth in the laminated labels market.


By Form, Reels dominated the market with 68 % share in 2023. For large-area marking, most labelling equipment uses roll-shaped labels. These reasons are driving the segment's expansion in the market.


Through the forecast period, sheets are expected to increase at a CAGR of 4 %. Demand for consumer and institutional labelling products for utilities, desktops, drawers, files, cabinets, cartons, and other personal items is increasing. These reasons are projected to fuel the segment's growth in the laminated labels market.


Laminated Labels Market


Laminated Labels Market Regional Insights:

In 2023, Asia Pacific dominated the market with a share of 40 %. Demand in the region is being driven by growth in the food and beverage, consumer durables, and pharmaceutical industries. The CLP Regulation on the categorization, labelling, and packaging of chemicals and mixtures is being enforced. Increased manufacturing investment in rising economies like China and India. These factors are driving the APAC laminated labels market.


Throughout the forecast period, Europe is expected to increase at a CAGR of 6 %. Growing demand for high-quality labels, film laminated labels, and other factors are projected to drive the market forward throughout the forecast period.


Laminated Labels Market Key Players Insights:

The market is characterized by the existence of a number of well-known firms. These companies control a large portion of the market, have a wide product portfolio, and have a global presence. In addition, the market comprises small to mid-sized competitors that sell a limited variety of items, some of which are self-publishing organizations.


The laminated labels market's major companies have a significant impact because most of them have extensive global networks through which they can reach their massive client bases. To drive revenue growth and strengthen their positions in the global market, key players in the market, particularly in Europe and North America, are focusing on strategic initiatives such as acquisitions, new collection launches, and partnerships.


The objective of the report is to present a comprehensive analysis of the Global Laminated Labels market to the stakeholders in the industry. The report provides trends that are most dominant in the Global Laminated Labels market and how these trends will influence new business investments and market development throughout the forecast period. The report also aids in the comprehension of the global market dynamics and competitive structure of the market by analyzing market leaders, market followers, and regional players.


The qualitative and quantitative data provided in the Global Laminated Labels market report is to help understand which market segments, regions are expected to grow at higher rates, factors affecting the market, and key opportunity areas, which will drive the industry and market growth through the forecast period. The report also includes the competitive landscape of key players in the industry along with their recent developments in the Global Laminated Labels market. The report studies factors such as company size, market share, market growth, revenue, production volume, and profits of the key players in the global market.


Laminated Labels Market


The report provides Porter's Five Force Model, which helps in designing the business strategies in the market. The report helps in identifying how many rivals are existing, who they are, and how their product quality is in the Global Laminated Labels market. The report also analyses if the Global Laminated Labels market is easy for a new player to gain a foothold in the market, do they enter or exit the market regularly if the market is dominated by a few players, etc.


The report also includes a PESTEL Analysis, which aids in the development of company strategies. Political variables help in figuring out how much a government can influence the Global Laminated Labels market. Economic variables aid in the analysis of economic performance drivers that have an impact on the Global Laminated Labels market. Understanding the impact of the surrounding environment and the influence of environmental concerns on the global market is aided by legal factors.


Laminated Labels Market Scope:

Laminated Labels Market 

Market Size in 2023

USD 120.05 Bn.

Market Size in 2030

USD 192.78 Bn.

CAGR (2024-2030)

7%

Historic Data

2018-2022

Base Year

2023

Forecast Period

2024-2030

Segment Scope

By Composition

  • Laminate
  • Facestock
  • Adhesive
  • Release liner

By Type

  • Polyester
  • Polypropylene
  • UV sunscreen polyester
  • Others

By Form

  • Reels
  • Sheets

Regional Scope

North America- United States, Canada, and Mexico

Europe – UK, France, Germany, Italy, Spain, Sweden, Austria, and Rest of Europe

Asia Pacific – China, India, Japan, South Korea, Australia, ASEAN, Rest of APAC

Middle East and Africa - South Africa, GCC, Egypt, Nigeria, Rest of the Middle East and Africa

South America – Brazil, Argentina, Rest of South America


LAMINATED LABELS MARKET KEY PLAYERS: 

  • A3M ( Delhi, India)
  • Avery Dennison Corporation (California, United States)
  • CCL Industries Inc. (Toronto, Canada)
  • UPM (Helsinki, Finland)
  • Honeywell International Inc.  (North Carolina, United States)
  • Tesa SE-A Beiersdorf Company (Hamburg, Germany)
  • Seiko Holdings Corporation  (Tokyo, Japan)
  • Laminated labels International
  • Sandora Sales and Manufacturing Ltd. (Canada)
  • Polylabel (Canada)
  • Intertronics (United Kingdom)
  • R. Donnelley & Sons Company ( Chicago, United States)
  • OpSec Security Group Ltd.  (Colorado, United States)
  • Guangzhou Manborui Material Technology Co Ltd.  (China)
  • Constania (Vienna , Austria)
  •  (* Key Players List Not Exhaustive)


Frequently Asked Questions

The segments covered in the Laminated Labels Market report are based on Composition, Type, and Form.

Chapter 1 Scope of the Report
Chapter 2 Research Methodology

      2.1.Research Process
      2.2.Global Laminated Labels Market: Target Audience
      2.3.Global Laminated Labels Market: Primary Research (As per Client Requirement)
      2.4.Global Laminated Labels Market: Secondary Research
Chapter 3 Executive Summary
Chapter 4 Competitive Landscape

      4.1. Market Share Analysis, By Value, 2023-2030
            4.1.1.Market Share Analysis, By Region, By Value, 2023-2030 (In %)
                        4.1.1.1.North America Market Share Analysis, By Value, 2023-2030 (In %)
                        4.1.1.2.Europe Market Share Analysis, By Value, 2023-2030 (In %)
                        4.1.1.3.Asia Pacific Market Share Analysis, By Value, 2023-2030 (In %)
                        4.1.1.4.South America Market Share Analysis, By Value, 2023-2030 (In %)
                        4.1.1.5.Middle East and Africa Market Share Analysis, By Value, 2023-2030 (In %)
            4.1.2. Market Share Analysis, By Composition, By Value, 2023-2030 (In %)
                  4.1.2.1.North America Market Share Analysis, By Composition, By Value, 2023-2030 (In %)
                        4.1.2.1.1.USA Market Share Analysis, By Composition, By Value, 2023-2030 (In %)
                        4.1.2.1.2.Canada Market Share Analysis, By Composition, By Value, 2023-2030 (In %)
                        4.1.2.1.3.Mexico Market Share Analysis, By Composition, By Value, 2023-2030 (In %)
                  4.1.2.2. Europe Market Share Analysis, By Composition, By Value, 2023-2030 (In %)
                        4.1.2.2.1.UK Market Share Analysis, By Composition, By Value, 2023-2030 (In %)
                        4.1.2.2.2.France Market Share Analysis, By Composition, By Value, 2023-2030 (In %)
                        4.1.2.2.3.Germany Market Share Analysis, By Composition, By Value, 2023-2030 (In %)
                        4.1.2.2.4.Italy Market Share Analysis, By Composition, By Value, 2023-2030 (In %)
                        4.1.2.2.5.Spain Market Share Analysis, By Composition, By Value, 2023-2030 (In %)
                        4.1.2.2.6.Sweden Market Share Analysis, By Composition, By Value, 2023-2030 (In %)
                        4.1.2.2.7.Austria Market Share Analysis, By Composition, By Value, 2023-2030 (In %)
                        4.1.2.2.8.Rest of Europe Market Share Analysis, By Composition, By Value, 2023-2030 (In %)
                        4.1.2.3. Asia Pacific Market Share Analysis, By Composition, By Value, 2023-2030 (In %)
                        4.1.2.3.1. China Market Share Analysis, By Composition, By Value, 2023-2030 (In %)
                        4.1.2.3.2.India Market Share Analysis, By Composition, By Value, 2023-2030 (In %)
                        4.1.2.3.3.Japan Market Share Analysis, By Composition, By Value, 2023-2030 (In %)
                        4.1.2.3.4.South Korea Market Share Analysis, By Composition, By Value, 2023-2030 (In %)
                        4.1.2.3.5.Australia Market Share Analysis, By Composition, By Value, 2023-2030 (In %)
                        4.1.2.3.6.ASEAN Market Share Analysis, By Composition, By Value, 2023-2030 (In %)
                        4.1.2.3.7.Rest of APAC Market Share Analysis, By Composition, By Value, 2023-2030 (In %)
                  4.1.2.4. South America Market Share Analysis, By Composition, By Value, 2023-2030 (In %)
                        4.1.2.4.1.Brazil Market Share Analysis, By Composition, By Value, 2023-2030 (In %)
                        4.1.2.4.2.Argentina Market Share Analysis, By Composition, By Value, 2023-2030 (In %)
                        4.1.2.4.3.Rest of South America Market Share Analysis, By Composition, By Value, 2023-2030 (In %)
                  4.1.2.5. Middle East and Africa Market Share Analysis, By Composition, By Value, 2023-2030 (In %)
                        4.1.2.5.1.South Africa Market Share Analysis, By Composition, By Value, 2023-2030 (In %)
                        4.1.2.5.2.GCC Market Share Analysis, By Composition, By Value, 2023-2030 (In %)
                        4.1.2.5.3.Egypt Market Share Analysis, By Composition, By Value, 2023-2030 (In %)
                        4.1.2.5.4.Nigeria Market Share Analysis, By Composition, By Value, 2023-2030 (In %)
                        4.1.2.5.5.Rest of Middle East and Africa Market Share Analysis, By Composition, By Value, 2023-2030 (In %)
      4.1.3. Market Share Analysis, By Type, By Value, 2023-2030 (In %)
      4.1.4. North America Market Share Analysis, By Type, By Value, 2023-2030 (In %)
                        4.1.4.1.1.USA Market Share Analysis, By Type, By Value, 2023-2030 (In %)
                        4.1.4.1.2.Canada Market Share Analysis, By Type, By Value, 2023-2030 (In %)
                        4.1.4.1.3.Mexico Market Share Analysis, By Type, By Value, 2023-2030 (In %)
                  4.1.4.2. Europe Market Share Analysis, By Type, By Value, 2023-2030 (In %)
                        4.1.4.2.1.UK Market Share Analysis, By Type, By Value, 2023-2030 (In %)
                        4.1.4.2.2.France Market Share Analysis, By Type, By Value, 2023-2030 (In %)
                        4.1.4.2.3.Germany Market Share Analysis, By Type, By Value, 2023-2030 (In %)
                        4.1.4.2.4.Italy Market Share Analysis, By Type, By Value, 2023-2030 (In %)
                        4.1.4.2.5.Spain Market Share Analysis, By Type, By Value, 2023-2030 (In %)
                        4.1.4.2.6.Sweden Market Share Analysis, By Type, By Value, 2023-2030 (In %)
                        4.1.4.2.7.Austria Market Share Analysis, By Type, By Value, 2023-2030 (In %)
                        4.1.4.2.8.Rest of Europe Market Share Analysis, By Type, By Value, 2023-2030 (In %)
                  4.1.4.3. Asia Pacific Market Share Analysis, By Type, By Value, 2023-2030 (In %)
                        4.1.4.3.1.China Market Share Analysis, By Type, By Value, 2023-2030 (In %)
                        4.1.4.3.2.India Market Share Analysis, By Type, By Value, 2023-2030 (In %)
                        4.1.4.3.3.Japan Market Share Analysis, By Type, By Value, 2023-2030 (In %)
                        4.1.4.3.4.South Korea Market Share Analysis, By Type, By Value, 2023-2030 (In %)
                        4.1.4.3.5.Australia Market Share Analysis, By Type, By Value, 2023-2030 (In %)
                        4.1.4.3.6.ASEAN Market Share Analysis, By Type, By Value, 2023-2030 (In %)
                        4.1.4.3.7.Rest of APAC Market Share Analysis, By Type, By Value, 2023-2030 (In %)
                  4.1.4.4.South America Market Share Analysis, By Type, By Value, 2023-2030 (In %)
                        4.1.4.4.1.Brazil Market Share Analysis, By Type, By Value, 2023-2030 (In %)
                        4.1.4.4.2.Argentina Market Share Analysis, By Type, By Value, 2023-2030 (In %)
                        4.1.4.4.3.Rest of South America Market Share Analysis, By Type, By Value, 2023-2030 (In %)
                  4.1.4.5.Middle East and Africa Market Share Analysis, By Type, By Value, 2023-2030 (In %)
                        4.1.4.5.1.South Africa Market Share Analysis, By Type, By Value, 2023-2030 (In %)
                        4.1.4.5.2.GCC Market Share Analysis, By Type, By Value, 2023-2030 (In %)
                        4.1.4.5.3.Egypt Market Share Analysis, By Type, By Value, 2023-2030 (In %)
                        4.1.4.5.4.Nigeria Market Share Analysis, By Type, By Value, 2023-2030 (In %)
                        4.1.4.5.5.Rest of Middle East and Africa Market Share Analysis, By Type, By Value, 2023-2030 (In %)
      4.1.5. Market Share Analysis, By Form, By Value, 2023-2030 (In %)
      4.1.6. North America Market Share Analysis, By Form, By Value, 2023-2030 (In %)
                        4.1.6.1.1.USA Market Share Analysis, By Form, By Value, 2023-2030 (In %)
                        4.1.6.1.2.Canada Market Share Analysis, By Form, By Value, 2023-2030 (In %)
                        4.1.6.1.3.Mexico Market Share Analysis, By Form, By Value, 2023-2030 (In %)
                  4.1.6.2. Europe Market Share Analysis, By Form, By Value, 2023-2030 (In %)
                        4.1.6.2.1.UK Market Share Analysis, By Form, By Value, 2023-2030 (In %)
                        4.1.6.2.2.France Market Share Analysis, By Form, By Value, 2023-2030 (In %)
                        4.1.6.2.3.Germany Market Share Analysis, By Form, By Value, 2023-2030 (In %)
                        4.1.6.2.4.Italy Market Share Analysis, By Form, By Value, 2023-2030 (In %)
                        4.1.6.2.5.Spain Market Share Analysis, By Form, By Value, 2023-2030 (In %)
                        4.1.6.2.6.Sweden Market Share Analysis, By Form, By Value, 2023-2030 (In %)
                        4.1.6.2.7.Austria Market Share Analysis, By Form, By Value, 2023-2030 (In %)
                        4.1.6.2.8.Rest of Europe Market Share Analysis, By Form, By Value, 2023-2030 (In %)
                  4.1.6.3. Asia Pacific Market Share Analysis, By Form, By Value, 2023-2030 (In %)
                        4.1.6.3.1.China Market Share Analysis, By Form, By Value, 2023-2030 (In %)
                        4.1.6.3.2.India Market Share Analysis, By Form, By Value, 2023-2030 (In %)
                        4.1.6.3.3.Japan Market Share Analysis, By Form, By Value, 2023-2030 (In %)
                        4.1.6.3.4.South Korea Market Share Analysis, By Form, By Value, 2023-2030 (In %)
                        4.1.6.3.5.Australia Market Share Analysis, By Form, By Value, 2023-2030 (In %)
                        4.1.6.3.6.ASEAN Market Share Analysis, By Form, By Value, 2023-2030 (In %)
                        4.1.6.3.7.Rest of APAC Market Share Analysis, By Form, By Value, 2023-2030 (In %)
                  4.1.6.4. South America Market Share Analysis, By Form, By Value, 2023-2030 (In %)
                        4.1.6.4.1.Brazil Market Share Analysis, By Form, By Value, 2023-2030 (In %)
                        4.1.6.4.2.Argentina Market Share Analysis, By Form, By Value, 2023-2030 (In %)
                        4.1.6.4.3.Rest of South America Market Share Analysis, By Form, By Value, 2023-2030 (In %)
                  4.1.6.5. Middle East and Africa Market Share Analysis, By Form, By Value, 2023-2030 (In %)
                        4.1.6.5.1.South Africa Market Share Analysis, By Form, By Value, 2023-2030 (In %)
                        4.1.6.5.2.GCC Market Share Analysis, By Form, By Value, 2023-2030 (In %)
                        4.1.6.5.3.Egypt Market Share Analysis, By Form, By Value, 2023-2030 (In %)
                        4.1.6.5.4.Nigeria Market Share Analysis, By Form, By Value, 2023-2030 (In %)
                        4.1.6.5.5.Rest of Middle East and Africa Market Share Analysis, By Form, By Value, 2023-2030 (In %)
      4.2. Stellar Competition matrix
            4.2.1.Global Stellar Competition Matrix
            4.2.2.North America Stellar Competition Matrix
            4.2.3.Europe Stellar Competition Matrix
            4.2.4.Asia Pacific Stellar Competition Matrix
            4.2.5.South America Stellar Competition Matrix
            4.2.6.Middle East and Africa Stellar Competition Matrix
      4.3. Key Players Benchmarking
            4.3.1.Key Players Benchmarking by Composition, Pricing, Market Share, Investments, Expansion Plans, Physical Presence and Presence in the Market.
      4.4. Mergers and Acquisitions in Industry
            4.4.1.M&A by Region, Value and Strategic Intent
      4.5. Market Dynamics
            4.5.1.Market Drivers
            4.5.2.Market Restraints
            4.5.3.Market Opportunities
            4.5.4.Market Challenges
            4.5.5.PESTLE Analysis
            4.5.6.PORTERS Five Force Analysis
            4.5.7.Value Chain Analysis
Chapter 5 Global Laminated Labels Market Segmentation: By Composition
      5.1.Global Laminated Labels Market, By Composition, Overview/Analysis, 2023-2030
      5.2.Global Laminated Labels Market, By Composition, By Value, Market Share (%), 2023-2030 (USD Million)
      5.3.Global Laminated Labels Market, By Composition, By Value,
            5.3.1.Laminate
            5.3.2.Facestock
            5.3.3.Adhesive
            5.3.4.Release liner
Chapter 6 Global Laminated Labels Market Segmentation: By Type
      6.1.Global Laminated Labels Market, By Type, Overview/Analysis, 2023-2030
      6.2.Global Laminated Labels Market Size, By Type, By Value, Market Share (%), 2023-2030 (USD Million)
      6.3.Global Laminated Labels Market, By Type, By Value,
            6.3.1.Polyester
            6.3.2.Polypropylene
            6.3.3.UV sunscreen polyester
            6.3.4.Others
Chapter 7 Global Laminated Labels Market Segmentation: By Form
      7.1.Global Laminated Labels Market, By Form, Overview/Analysis, 2023-2030
      7.2.Global Laminated Labels Market Size, By Form, By Value, Market Share (%), 2023-2030 (USD Million)
      7.3.Global Laminated Labels Market, By Form, By Value,
            7.3.1.Reels
            7.3.2.Sheets
Chapter 8 Global Laminated Labels Market Segmentation: By Region
      8.1.Global Laminated Labels Market, By Region – North America
            8.1.1.North America Laminated Labels Market Size, By Composition, By Value, 2023-2030 (USD Million)
            8.1.2.North America Laminated Labels Market Size, By Type, By Value, 2023-2030 (USD Million)
            8.1.3.North America Laminated Labels Market Size, By Form, By Value, 2023-2030 (USD Million)
            8.1.4. By Country – U.S.
                  8.1.4.1.U.S.Laminated Labels Market Size, By Composition, By Value, 2023-2030 (USD Million)
                  8.1.4.2.U.S.Laminated Labels Market Size, By Type, By Value, 2023-2030 (USD Million)
                  8.1.4.3.U.S.Laminated Labels Market Size, By Form, By Value, 2023-2030 (USD Million)
                  8.1.4.4.Canada Laminated Labels Market Size, By Value, 2023-2030 (USD Million)
                  8.1.4.5.Mexico Laminated Labels Market Size, By Value, 2023-2030 (USD Million)
      8.2. Europe Laminated Labels Market Size, By Value, 2023-2030 (USD Million)
            8.2.1.UK
            8.2.2.France
            8.2.3.Germany
            8.2.4.Italy
            8.2.5.Spain
            8.2.6.Sweden
            8.2.7.Austria
            8.2.8.Rest of Europe
      8.3. Asia Pacific Laminated Labels Market Size, By Value, 2023-2030 (USD Million)
            8.3.1.China
            8.3.2.India
            8.3.3.Japan
            8.3.4.South Korea
            8.3.5.Australia
            8.3.6.ASEAN
            8.3.7.Rest of APAC
      8.4. Middle East and Africa Laminated Labels Market Size, By Value, Chapter 1 Scope of the Report
Chapter 2 Research Methodology

      2.1.Research Process
      2.2.Global Laminated Labels Market: Target Audience
      2.3.Global Laminated Labels Market: Primary Research (As per Client Requirement)
      2.4.Global Laminated Labels Market: Secondary Research
Chapter 3 Executive Summary
Chapter 4 Competitive Landscape

      4.1. Market Share Analysis, By Value, 2023-2030
            4.1.1.Market Share Analysis, By Region, By Value, 2023-2030 (In %)
                        4.1.1.1.North America Market Share Analysis, By Value, 2023-2030 (In %)
                        4.1.1.2.Europe Market Share Analysis, By Value, 2023-2030 (In %)
                        4.1.1.3.Asia Pacific Market Share Analysis, By Value, 2023-2030 (In %)
                        4.1.1.4.South America Market Share Analysis, By Value, 2023-2030 (In %)
                        4.1.1.5.Middle East and Africa Market Share Analysis, By Value, 2023-2030 (In %)
            4.1.2. Market Share Analysis, By Composition, By Value, 2023-2030 (In %)
                  4.1.2.1.North America Market Share Analysis, By Composition, By Value, 2023-2030 (In %)
                        4.1.2.1.1.USA Market Share Analysis, By Composition, By Value, 2023-2030 (In %)
                        4.1.2.1.2.Canada Market Share Analysis, By Composition, By Value, 2023-2030 (In %)
                        4.1.2.1.3.Mexico Market Share Analysis, By Composition, By Value, 2023-2030 (In %)
                  4.1.2.2. Europe Market Share Analysis, By Composition, By Value, 2023-2030 (In %)
                        4.1.2.2.1.UK Market Share Analysis, By Composition, By Value, 2023-2030 (In %)
                        4.1.2.2.2.France Market Share Analysis, By Composition, By Value, 2023-2030 (In %)
                        4.1.2.2.3.Germany Market Share Analysis, By Composition, By Value, 2023-2030 (In %)
                        4.1.2.2.4.Italy Market Share Analysis, By Composition, By Value, 2023-2030 (In %)
                        4.1.2.2.5.Spain Market Share Analysis, By Composition, By Value, 2023-2030 (In %)
                        4.1.2.2.6.Sweden Market Share Analysis, By Composition, By Value, 2023-2030 (In %)
                        4.1.2.2.7.Austria Market Share Analysis, By Composition, By Value, 2023-2030 (In %)
                        4.1.2.2.8.Rest of Europe Market Share Analysis, By Composition, By Value, 2023-2030 (In %)
                        4.1.2.3. Asia Pacific Market Share Analysis, By Composition, By Value, 2023-2030 (In %)
                        4.1.2.3.1. China Market Share Analysis, By Composition, By Value, 2023-2030 (In %)
                        4.1.2.3.2.India Market Share Analysis, By Composition, By Value, 2023-2030 (In %)
                        4.1.2.3.3.Japan Market Share Analysis, By Composition, By Value, 2023-2030 (In %)
                        4.1.2.3.4.South Korea Market Share Analysis, By Composition, By Value, 2023-2030 (In %)
                        4.1.2.3.5.Australia Market Share Analysis, By Composition, By Value, 2023-2030 (In %)
                        4.1.2.3.6.ASEAN Market Share Analysis, By Composition, By Value, 2023-2030 (In %)
                        4.1.2.3.7.Rest of APAC Market Share Analysis, By Composition, By Value, 2023-2030 (In %)
                  4.1.2.4. South America Market Share Analysis, By Composition, By Value, 2023-2030 (In %)
                        4.1.2.4.1.Brazil Market Share Analysis, By Composition, By Value, 2023-2030 (In %)
                        4.1.2.4.2.Argentina Market Share Analysis, By Composition, By Value, 2023-2030 (In %)
                        4.1.2.4.3.Rest of South America Market Share Analysis, By Composition, By Value, 2023-2030 (In %)
                  4.1.2.5. Middle East and Africa Market Share Analysis, By Composition, By Value, 2023-2030 (In %)
                        4.1.2.5.1.South Africa Market Share Analysis, By Composition, By Value, 2023-2030 (In %)
                        4.1.2.5.2.GCC Market Share Analysis, By Composition, By Value, 2023-2030 (In %)
                        4.1.2.5.3.Egypt Market Share Analysis, By Composition, By Value, 2023-2030 (In %)
                        4.1.2.5.4.Nigeria Market Share Analysis, By Composition, By Value, 2023-2030 (In %)
                        4.1.2.5.5.Rest of Middle East and Africa Market Share Analysis, By Composition, By Value, 2023-2030 (In %)
      4.1.3. Market Share Analysis, By Type, By Value, 2023-2030 (In %)
      4.1.4. North America Market Share Analysis, By Type, By Value, 2023-2030 (In %)
                        4.1.4.1.1.USA Market Share Analysis, By Type, By Value, 2023-2030 (In %)
                        4.1.4.1.2.Canada Market Share Analysis, By Type, By Value, 2023-2030 (In %)
                        4.1.4.1.3.Mexico Market Share Analysis, By Type, By Value, 2023-2030 (In %)
                  4.1.4.2. Europe Market Share Analysis, By Type, By Value, 2023-2030 (In %)
                        4.1.4.2.1.UK Market Share Analysis, By Type, By Value, 2023-2030 (In %)
                        4.1.4.2.2.France Market Share Analysis, By Type, By Value, 2023-2030 (In %)
                        4.1.4.2.3.Germany Market Share Analysis, By Type, By Value, 2023-2030 (In %)
                        4.1.4.2.4.Italy Market Share Analysis, By Type, By Value, 2023-2030 (In %)
                        4.1.4.2.5.Spain Market Share Analysis, By Type, By Value, 2023-2030 (In %)
                        4.1.4.2.6.Sweden Market Share Analysis, By Type, By Value, 2023-2030 (In %)
                        4.1.4.2.7.Austria Market Share Analysis, By Type, By Value, 2023-2030 (In %)
                        4.1.4.2.8.Rest of Europe Market Share Analysis, By Type, By Value, 2023-2030 (In %)
                  4.1.4.3. Asia Pacific Market Share Analysis, By Type, By Value, 2023-2030 (In %)
                        4.1.4.3.1.China Market Share Analysis, By Type, By Value, 2023-2030 (In %)
                        4.1.4.3.2.India Market Share Analysis, By Type, By Value, 2023-2030 (In %)
                        4.1.4.3.3.Japan Market Share Analysis, By Type, By Value, 2023-2030 (In %)
                        4.1.4.3.4.South Korea Market Share Analysis, By Type, By Value, 2023-2030 (In %)
                        4.1.4.3.5.Australia Market Share Analysis, By Type, By Value, 2023-2030 (In %)
                        4.1.4.3.6.ASEAN Market Share Analysis, By Type, By Value, 2023-2030 (In %)
                        4.1.4.3.7.Rest of APAC Market Share Analysis, By Type, By Value, 2023-2030 (In %)
                  4.1.4.4.South America Market Share Analysis, By Type, By Value, 2023-2030 (In %)
                        4.1.4.4.1.Brazil Market Share Analysis, By Type, By Value, 2023-2030 (In %)
                        4.1.4.4.2.Argentina Market Share Analysis, By Type, By Value, 2023-2030 (In %)
                        4.1.4.4.3.Rest of South America Market Share Analysis, By Type, By Value, 2023-2030 (In %)
                  4.1.4.5.Middle East and Africa Market Share Analysis, By Type, By Value, 2023-2030 (In %)
                        4.1.4.5.1.South Africa Market Share Analysis, By Type, By Value, 2023-2030 (In %)
                        4.1.4.5.2.GCC Market Share Analysis, By Type, By Value, 2023-2030 (In %)
                        4.1.4.5.3.Egypt Market Share Analysis, By Type, By Value, 2023-2030 (In %)
                        4.1.4.5.4.Nigeria Market Share Analysis, By Type, By Value, 2023-2030 (In %)
                        4.1.4.5.5.Rest of Middle East and Africa Market Share Analysis, By Type, By Value, 2023-2030 (In %)
      4.1.5. Market Share Analysis, By Form, By Value, 2023-2030 (In %)
      4.1.6. North America Market Share Analysis, By Form, By Value, 2023-2030 (In %)
                        4.1.6.1.1.USA Market Share Analysis, By Form, By Value, 2023-2030 (In %)
                        4.1.6.1.2.Canada Market Share Analysis, By Form, By Value, 2023-2030 (In %)
                        4.1.6.1.3.Mexico Market Share Analysis, By Form, By Value, 2023-2030 (In %)
                  4.1.6.2. Europe Market Share Analysis, By Form, By Value, 2023-2030 (In %)
                        4.1.6.2.1.UK Market Share Analysis, By Form, By Value, 2023-2030 (In %)
                        4.1.6.2.2.France Market Share Analysis, By Form, By Value, 2023-2030 (In %)
                        4.1.6.2.3.Germany Market Share Analysis, By Form, By Value, 2023-2030 (In %)
                        4.1.6.2.4.Italy Market Share Analysis, By Form, By Value, 2023-2030 (In %)
                        4.1.6.2.5.Spain Market Share Analysis, By Form, By Value, 2023-2030 (In %)
                        4.1.6.2.6.Sweden Market Share Analysis, By Form, By Value, 2023-2030 (In %)
                        4.1.6.2.7.Austria Market Share Analysis, By Form, By Value, 2023-2030 (In %)
                        4.1.6.2.8.Rest of Europe Market Share Analysis, By Form, By Value, 2023-2030 (In %)
                  4.1.6.3. Asia Pacific Market Share Analysis, By Form, By Value, 2023-2030 (In %)
                        4.1.6.3.1.China Market Share Analysis, By Form, By Value, 2023-2030 (In %)
                        4.1.6.3.2.India Market Share Analysis, By Form, By Value, 2023-2030 (In %)
                        4.1.6.3.3.Japan Market Share Analysis, By Form, By Value, 2023-2030 (In %)
                        4.1.6.3.4.South Korea Market Share Analysis, By Form, By Value, 2023-2030 (In %)
                        4.1.6.3.5.Australia Market Share Analysis, By Form, By Value, 2023-2030 (In %)
                        4.1.6.3.6.ASEAN Market Share Analysis, By Form, By Value, 2023-2030 (In %)
                        4.1.6.3.7.Rest of APAC Market Share Analysis, By Form, By Value, 2023-2030 (In %)
                  4.1.6.4. South America Market Share Analysis, By Form, By Value, 2023-2030 (In %)
                        4.1.6.4.1.Brazil Market Share Analysis, By Form, By Value, 2023-2030 (In %)
                        4.1.6.4.2.Argentina Market Share Analysis, By Form, By Value, 2023-2030 (In %)
                        4.1.6.4.3.Rest of South America Market Share Analysis, By Form, By Value, 2023-2030 (In %)
                  4.1.6.5. Middle East and Africa Market Share Analysis, By Form, By Value, 2023-2030 (In %)
                        4.1.6.5.1.South Africa Market Share Analysis, By Form, By Value, 2023-2030 (In %)
                        4.1.6.5.2.GCC Market Share Analysis, By Form, By Value, 2023-2030 (In %)
                        4.1.6.5.3.Egypt Market Share Analysis, By Form, By Value, 2023-2030 (In %)
                        4.1.6.5.4.Nigeria Market Share Analysis, By Form, By Value, 2023-2030 (In %)
                        4.1.6.5.5.Rest of Middle East and Africa Market Share Analysis, By Form, By Value, 2023-2030 (In %)
      4.2. Stellar Competition matrix
            4.2.1.Global Stellar Competition Matrix
            4.2.2.North America Stellar Competition Matrix
            4.2.3.Europe Stellar Competition Matrix
            4.2.4.Asia Pacific Stellar Competition Matrix
            4.2.5.South America Stellar Competition Matrix
            4.2.6.Middle East and Africa Stellar Competition Matrix
      4.3. Key Players Benchmarking
            4.3.1.Key Players Benchmarking by Composition, Pricing, Market Share, Investments, Expansion Plans, Physical Presence and Presence in the Market.
      4.4. Mergers and Acquisitions in Industry
            4.4.1.M&A by Region, Value and Strategic Intent
      4.5. Market Dynamics
            4.5.1.Market Drivers
            4.5.2.Market Restraints
            4.5.3.Market Opportunities
            4.5.4.Market Challenges
            4.5.5.PESTLE Analysis
            4.5.6.PORTERS Five Force Analysis
            4.5.7.Value Chain Analysis
Chapter 5 Global Laminated Labels Market Segmentation: By Composition
      5.1.Global Laminated Labels Market, By Composition, Overview/Analysis, 2023-2030
      5.2.Global Laminated Labels Market, By Composition, By Value, Market Share (%), 2023-2030 (USD Million)
      5.3.Global Laminated Labels Market, By Composition, By Value,
            5.3.1.Laminate
            5.3.2.Facestock
            5.3.3.Adhesive
            5.3.4.Release liner
Chapter 6 Global Laminated Labels Market Segmentation: By Type
      6.1.Global Laminated Labels Market, By Type, Overview/Analysis, 2023-2030
      6.2.Global Laminated Labels Market Size, By Type, By Value, Market Share (%), 2023-2030 (USD Million)
      6.3.Global Laminated Labels Market, By Type, By Value,
            6.3.1.Polyester
            6.3.2.Polypropylene
            6.3.3.UV sunscreen polyester
            6.3.4.Others
Chapter 7 Global Laminated Labels Market Segmentation: By Form
      7.1.Global Laminated Labels Market, By Form, Overview/Analysis, 2023-2030
      7.2.Global Laminated Labels Market Size, By Form, By Value, Market Share (%), 2023-2030 (USD Million)
      7.3.Global Laminated Labels Market, By Form, By Value,
            7.3.1.Reels
            7.3.2.Sheets
Chapter 8 Global Laminated Labels Market Segmentation: By Region
      8.1.Global Laminated Labels Market, By Region – North America
            8.1.1.North America Laminated Labels Market Size, By Composition, By Value, 2023-2030 (USD Million)
            8.1.2.North America Laminated Labels Market Size, By Type, By Value, 2023-2030 (USD Million)
            8.1.3.North America Laminated Labels Market Size, By Form, By Value, 2023-2030 (USD Million)
            8.1.4. By Country – U.S.
                  8.1.4.1.U.S.Laminated Labels Market Size, By Composition, By Value, 2023-2030 (USD Million)
                  8.1.4.2.U.S.Laminated Labels Market Size, By Type, By Value, 2023-2030 (USD Million)
                  8.1.4.3.U.S.Laminated Labels Market Size, By Form, By Value, 2023-2030 (USD Million)
                  8.1.4.4.Canada Laminated Labels Market Size, By Value, 2023-2030 (USD Million)
                  8.1.4.5.Mexico Laminated Labels Market Size, By Value, 2023-2030 (USD Million)
      8.2. Europe Laminated Labels Market Size, By Value, 2023-2030 (USD Million)
            8.2.1.UK
            8.2.2.France
            8.2.3.Germany
            8.2.4.Italy
            8.2.5.Spain
            8.2.6.Sweden
            8.2.7.Austria
            8.2.8.Rest of Europe
      8.3. Asia Pacific Laminated Labels Market Size, By Value, 2023-2030 (USD Million)
            8.3.1.China
            8.3.2.India
            8.3.3.Japan
            8.3.4.South Korea
            8.3.5.Australia
            8.3.6.ASEAN
            8.3.7.Rest of APAC
      8.4. Middle East and Africa Laminated Labels Market Size, By Value, 2023-2030 (USD Million)
            8.4.1.South Africa
            8.4.2.GCC
            8.4.3.Egypt
            8.4.4.Nigeria
            8.4.5.Rest of Middle East and Africa
      8.5. South America Laminated Labels Market Size, By Value, 2023-2030 (USD Million)
            8.5.1.Brazil
            8.5.2.Argentina
            8.5.3.Rest of South America
Chapter 9 Company Profiles
      9.1.Key Players
            9.1.1.A3M ( Delhi, India)
                  9.1.1.1.Company Overview
                  9.1.1.2.Composition Portfolio
                  9.1.1.3.Financial Overview
                  9.1.1.4.Business Strategy
                  9.1.1.5.Key Developments
            9.1.2.Avery Dennison Corporation (California, United States)
            9.1.3.CCL Industries Inc. (Toronto, Canada)
            9.1.4.UPM (Helsinki, Finland)
            9.1.5.Honeywell International Inc. (North Carolina, United States)
            9.1.6.Tesa SE-A Beiersdorf Company (Hamburg, Germany)
            9.1.7.Seiko Holdings Corporation (Tokyo, Japan)
            9.1.8.Laminated labels International
            9.1.9.Sandora Sales and Manufacturing Ltd. (Canada)
            9.1.10.Polylabel (Canada)
            9.1.11.Intertronics (United Kingdom)
            9.1.12.R. Donnelley & Sons Company ( Chicago, United States)
            9.1.13.OpSec Security Group Ltd. (Colorado, United States)
            9.1.14.Guangzhou Manborui Material Technology Co Ltd. (China)
            9.1.15.Constania (Vienna , Austria)
      9.2. Key Findings
      9.3. Recommendations (USD Million)
            8.4.1.South Africa
            8.4.2.GCC
            8.4.3.Egypt
            8.4.4.Nigeria
            8.4.5.Rest of Middle East and Africa
      8.5. South America Laminated Labels Market Size, By Value, 2023-2030 (USD Million)
            8.5.1.Brazil
            8.5.2.Argentina
            8.5.3.Rest of South America
Chapter 9 Company Profiles
      9.1.Key Players
            9.1.1.A3M ( Delhi, India)
                  9.1.1.1.Company Overview
                  9.1.1.2.Composition Portfolio
                  9.1.1.3.Financial Overview
                  9.1.1.4.Business Strategy
                  9.1.1.5.Key Developments
            9.1.2.Avery Dennison Corporation (California, United States)
            9.1.3.CCL Industries Inc. (Toronto, Canada)
            9.1.4.UPM (Helsinki, Finland)
            9.1.5.Honeywell International Inc. (North Carolina, United States)
            9.1.6.Tesa SE-A Beiersdorf Company (Hamburg, Germany)
            9.1.7.Seiko Holdings Corporation (Tokyo, Japan)
            9.1.8.Laminated labels International
            9.1.9.Sandora Sales and Manufacturing Ltd. (Canada)
            9.1.10.Polylabel (Canada)
            9.1.11.Intertronics (United Kingdom)
            9.1.12.R. Donnelley & Sons Company ( Chicago, United States)
            9.1.13.OpSec Security Group Ltd. (Colorado, United States)
            9.1.14.Guangzhou Manborui Material Technology Co Ltd. (China)
            9.1.15.Constania (Vienna , Austria)
      9.2. Key Findings
      9.3. Recommendations

Enquiry Before Buy


Request Sample PDF