Industrial Boiler Market Analysis (2026–2032) Technology Adoption, End-Use Industry Demand, and Regional Outlook
The Global Industrial Boiler Market size was valued at USD 17.12 Bn in 2025 and is projected to grow at a CAGR of 4.07% from 2026 to 2032, reaching nearly USD 22.63 Bn by 2032. The industrial boiler market growth is primarily driven by rising demand from food processing, petrochemicals, chemicals, power generation, and manufacturing industries, where steam and hot water remain critical process inputs.
The rising number of industrial boiler units sold, coupled with higher market penetration of energy-efficient and low-emission boiler systems, is driving industrial boiler market adoption globally. Industrial boilers play a vital role in process heating, power generation, and energy recovery, making them indispensable across heavy and light industrial applications.
Industrial Boiler Market Key Highlight:
- The Global Industrial Boiler Market size reached USD 17.12 Bn in 2025, supported by strong industrial output and infrastructure expansion.
- The water tube boiler segment is expected to register the fastest CAGR of 5.14% (2026–2032) due to higher efficiency, faster steam generation, and suitability for high-pressure applications.
- Natural gas and biomass industrial boilers dominated the market with a 44.25% share in 2025, reflecting increased adoption of cleaner fuels and stricter emission regulations.
- Steam boilers accounted for 64.67% of the global market share in 2025, driven by widespread usage across process industries such as chemicals, food & beverages, and refineries.
- In India, over 45,000 steam boiler units are installed, generating nearly 1.26 billion tonnes of steam annually, representing a high penetration rate in core manufacturing sectors and contributing to over 25% of industrial GHG emissions, highlighting the need for efficient boiler upgrades.
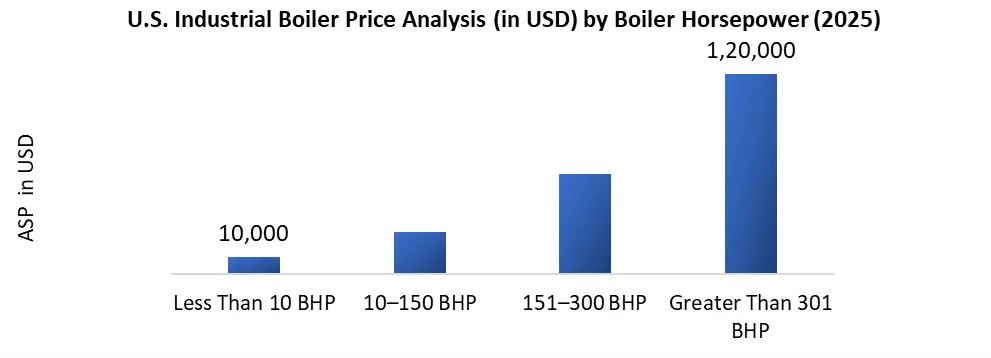
Industrial Boiler Market Pricing Analysis:
To get more Insights: Request Free Sample Report
The global industrial boiler market pricing is determined by regional factors, fuel types, and technology integration. In developed markets like the U.S., boiler prices are higher due to stringent regulations and demand for energy-efficient, low-emission systems. For instance, in 2025, a 10–150 BHP industrial boiler in the U.S. is expected to have an ASP of around USD 25,000, driven by the need for advanced controls, safety features, and compliance with EPA standards.
Industrial Boiler Market Dynamics:
Adoption of Biomass Boilers for Sustainable Industrial Heating
The growing demand for biomass boilers as an energy-efficient, environmentally friendly alternative for space and process heating is driving industrial boiler market growth. Biomass boilers are replacing traditional oil and gas boilers in sectors such as food processing, where nearly 10,000 boilers were used across the U.S. manufacturing industry in 2025. Biomass technology could replace up to 20% of these existing boilers over the forecast period. In response to this demand, companies like Babcock & Wilcox (B&W) are investing in biomass boiler technology, securing contracts for example their USD 11 million project in Canada to design, produce, and install biomass boiler systems for industrial applications.
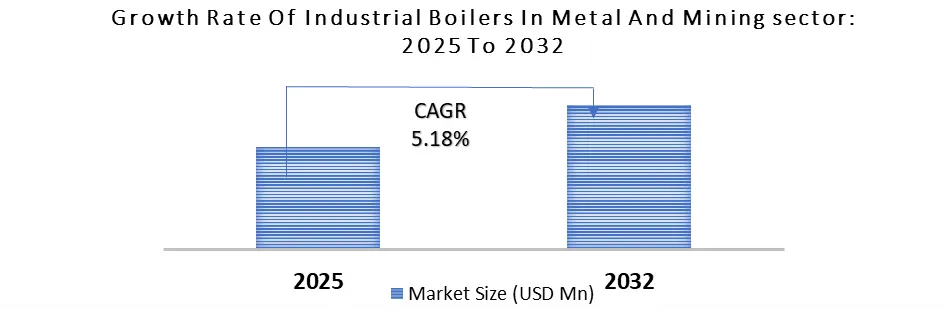
Mining Sector Growth Driving Demand for Industrial Boilers:
The growth in mining activities is expected to drive the growth of the industrial boilers market over the forecast period. Mining, which includes extracting valuable minerals and resources, relies heavily on industrial boilers for vital heat and energy in applications like processing, smelting, and HVAC systems.
Industrial Boiler Market Trends:
- Rapid industrialization and growing adoption of high-efficiency industrial boilers are increasing replacement demand in mature markets.
- Growing focus on industrial automation, IoT-enabled boilers, and digital monitoring systems is improving fuel efficiency, uptime, and operational safety.
- Increasing market penetration of biomass and natural gas boilers is driven by global decarbonization initiatives.
- The USD 235 billion federal clean energy investment in 2025 is expected to accelerate industrial boiler adoption, particularly in sustainable manufacturing and energy-intensive industries.
- Rising adoption rates of advanced boiler technologies position developed economies as exporters of high-efficiency industrial boiler systems.
Industrial Boiler Market Segment Analysis
By Fuel Type, the Water tube segment dominated the Industrial Boiler market and accounted for a market share of nearly 62.45% in 2025. This growth is attributed to the ability to generate high-pressure steam and its suitability for applications such as power generation, petrochemical plants, and food processing, where high steam output is required. Over the forecast period, the Industrial Boiler market in water tube segment is expected to register the fastest CAGR of 5.14%.

By Boiler Horsepower, Natural Gas and Biomass segment held 44.25% of the global Industrial Boiler market share in 2025. This is due to the growing use of natural gas-powered industrial boilers in many industries, and the rising trend of replacing coal with renewable fuels such as biomass.
In 2025, coal fuel type is the second most dominating segment of the industrial boiler system market value. This growth is driven by its widespread availability and lower costs as compared to the other fuel types.
Global Industrial Boiler Market Regional Analysis
Asia Pacific held the largest share in the Industrial Boiler Market with a 42.18% market share in 2025. This growth is driven by rapid industrialization, increasing energy needs, the presence of major manufacturing hubs, favourable government initiatives, a shift to cleaner fuels, and rising demand from end-use industries.
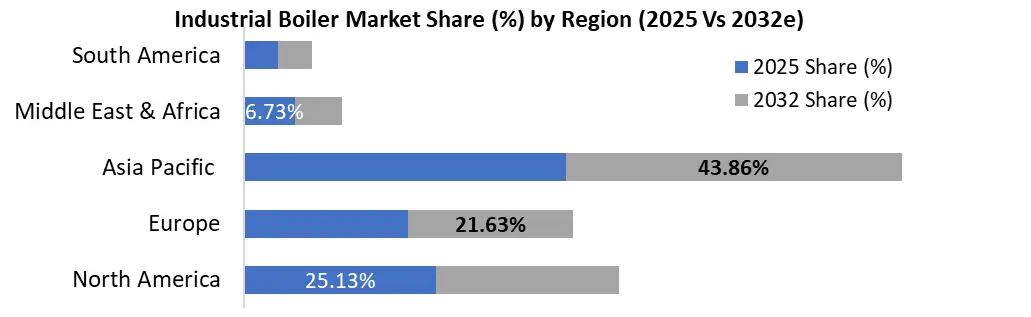
North American Industrial Boiler market held 25.13% of global value share in 2025. This was driven by the region’s established industrial base, with significant activities in manufacturing, chemicals, petrochemicals, and food processing, along with the adoption of advanced boiler technologies.
Country wise Insight in Industrial Boiler Market:
|
Country |
Key Highlight |
|
China |
Rapid industrialization and increased energy consumption are driving demand for industrial boilers, paticularly in manufacturing and processing industries. |
|
Japan |
The carbon emissions trading system set for 2026 will cover 60% of Japan’s domestic emissions, encouraging the adoption of energy-efficient and low-emission boilers in sectors like steel, automobiles, and electricity. |
|
India |
With over 45,000 steam boilers generating 1.26 billion tonnes of steam annually, India is focusing on reducing industrial GHG emissions through low-carbon technologies for industrial boilers. |
|
Germany |
Emphasizing energy efficiency, emission reductions, and sustainability, Germany is pushing for advanced boiler technologies in industries like chemical and manufacturing. |
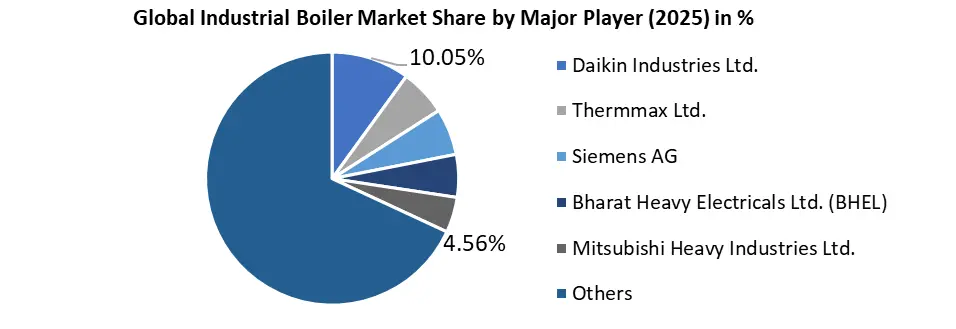
Industrial Boiler Market Competitive Landscape Analysis
Key Players operating in the industrial boilers market are focused on emerging innovative solutions for high efficiency industrial electric boilers to reduce carbon emissions, enhance energy efficiency, and improve operational flexibility.
Industrial Boiler Market Company’s Recent Developments
|
Year |
Key Developments |
|
In August 2025 |
Bosch company launched an inclusive digital platform that integrates IoT capabilities into its boiler systems, enabling real-time monitoring and predictive maintenance. This enterprise reflects Bosch's focus on digitalization and its potential to enhance operational efficiency for clients. |
|
In March 2025 |
The Environmental Group exposed that it has entered into a binding agreement to purchase Advanced Boilers & Combustion for US$5.5 million, enhancing its industrial boiler service and production capabilities. The purchase will be financed using current cash reserves and decided by 5 April 2025, as stated in a release to the ASX. |
Industrial Boiler Market Scope
|
Industrial Boiler Market |
|||
|
This Report Covers |
Details |
||
|
Base Year: |
2025 |
Forecast Period: |
2026-2032 |
|
Historical Data: |
2020 to 2025 |
Market Size in 2025: |
USD 17.12 Bn |
|
Forecast Period 2026 to 2032 CAGR: |
4.07% |
Market Size in 2032: |
USD 22.63 Bn |
|
Industrial Boiler Market Segments Covered: |
By Boiler Type |
Water Tube Fire Tube |
|
|
By Fuel Type |
Natural Gas and Biomass Coal Oil Others |
||
|
By Function |
Hot Water Steam |
||
|
By Boiler Horsepower |
Less Than 10 BHP 10-150 BHP 151-300 BHP Greater Than 301 BHP |
||
|
By End-Use Industry |
Chemicals & Petrochemicals Food & Beverages Paper & Pulp Metals & Mining Others |
||
Industrial Boiler Market, by Region
North America (United States, Canada and Mexico)
Europe (UK, France, Germany, Italy, Spain, Sweden, Austria and Rest of Europe)
Asia Pacific (China, South Korea, Japan, India, Australia, ASEAN and Rest of APAC)
South America (Brazil, Argentina Rest of South America)
Middle East & Africa (South Africa, GCC, and Rest of ME&A)
Industrial Boiler Market Key Players
- Daikin Industries Ltd.
- Thermax Ltd.
- Siemens AG
- Bharat Heavy Electricals Ltd.
- Forbes Marshall
- Mitsubishi Heavy Industries Ltd.
- Harbin Oil Corporation
- Cheema Boilers Limited
- IHI Corporation
- AC Boilers
- Dongfang Oil Corporation Ltd.
- CleaverBrooks
- Babcock & Wilcox Enterprises
- Clayton Industries
- Cochran
- Doosan Heavy Industries and Construction
- Bosch Industriekessel GmbH
- Ekotek Kazan Ltd.
- SILSON
- Unilux Advanced Manufacturing, LLC
- Fulton
- Nationwide Boiler Inc.
- Reimers Electra Steam Inc.
- Victory Energy
- Columbia Boiler Company
- John Cockerill
- Miura Co. Ltd.
- Hurst Boiler & Welding Co.
- Alpha Laval AB
- Vyncke
Frequently Asked Questions
APAC dominated the market thanks to rapid industrialization, increasing energy needs, the presence of major manufacturing hubs, and rising demand from end-use industries.
Global Industrial Boiler Market is growing at a CAGR of 4.07% during the forecasting period 2026-2032.
Leading companies include Daikin Industries Ltd, Thermax Ltd., Siemens AG, Forbes Marshall and others.
1. Industrial Boiler Market Introduction
1.1. Study Assumption and Market Definition
1.2. Scope of the Study
1.3. Executive Summary
2. Global Industrial Boiler Market: Competitive Landscape
2.1. MMR Competition Matrix
2.2. Key Players Benchmarking
2.2.1. Company Name
2.2.2. Headquarter
2.2.3. Industrial Boiler Type
2.2.4. Fuel Type
2.2.5. Number of Industrial Boiler sold (2025)
2.2.6. End-User Segment
2.2.7. Revenue Details in 2025
2.2.8. Market Share (%)
2.2.9. Growth Rate (%)
2.2.10. Return on Investment (%)
2.2.11. Technological Capabilities
2.2.12. Geographical Presence
2.3. Market Structure
2.3.1. Market Leaders
2.3.2. Market Followers
2.3.3. Emerging Players
2.4. Mergers and Acquisitions Details
3. Industrial Boiler Market: Dynamics
3.1. Industrial Boiler Market Trends
3.2. Industrial Boiler Market Dynamics
3.2.1. Drivers
3.2.2. Restraints
3.2.3. Opportunities
3.2.4. Challenges
3.3. PORTER’s Five Forces Analysis
3.4. PESTLE Analysis
3.5. Regulatory Landscape by Region
3.6. Key Opinion Leader Analysis for the Global Industry
3.7. Analysis of Government Schemes and Initiatives for Industry
4. Industrial Boiler Market Trade Analysis (2025)
4.1. Global Import and Export Volumes of Industrial Boiler by Region
4.2. Major Exporting and Importing Countries for Industrial Boiler
4.3. Trade Regulations, Industrial Standards, and Certification Requirements
4.4. Global Trade Flow Mapping and Value Chain Shift
4.5. Impact of Supply Chain Disruptions on Industrial Boiler Availability
4.6. Role of Regional Trade Agreements and Localization Policies
5. Industrial Boiler Market Consumption Analysis (2025)
5.1. Global Industrial Boiler Consumption (000’Units) by region
5.2. Capacity Utilization and Consumption Patterns in the Industrial Boiler Market
5.3. Growth of Industrial Boiler Consumption in Emerging Markets
5.4. Technological Integration and Its Influence on Boiler Consumption
5.5. Government Incentives and Their Effect on Industrial Boiler Demand
5.6. Economic Cycles and Their Impact on Industrial Boiler Consumption
6. Industrial Boiler Market Demand Analysis Industrial Boiler Market
6.1. Regional Demand Analysis for Industrial Boilers (2025–2032)
6.2. Demand for Industrial Boilers in Key End-Use Industry
6.3. Key Drivers of Demand in the Industrial Boiler Market
6.4. Impact of Industrialization on Boiler Demand Across Regions
6.5. Demand Shifts Driven by Fuel Type Preferences in the Boiler Market
6.6. Sector-Specific Demand Analysis for Industrial Boilers
7. Industrial Boiler Market Pricing Analysis (2025)
7.1. Average Pricing Trends for Industrial Boilers in 2025
7.2. Regional Pricing Analysis of Industrial Boilers (2025)
7.3. Price Comparison: Gas Water Tube vs Fire Tube
7.4. Impact of Technological Advancements on Industrial Boiler Pricing
7.5. Pricing Strategies of Key Players in the Industrial Boiler Market
7.6. Factors Affecting Industrial Boiler Prices: Raw Materials, Labor, and Regulations
7.7. Pricing Impact of Sustainability and Energy Efficiency Regulations
7.8. Influence of Global Supply Chain on Industrial Boiler Pricing (2025)
8. Industrial Boiler Market Supply Chain & Manufacturing Insights
8.1. Global Supply Chain Analysis for Industrial Boilers
8.2. Key Suppliers and Raw Materials in Industrial Boiler Manufacturing
8.3. Manufacturing Trends in the Industrial Boiler Industry
8.4. Impact of Supply Chain Disruptions on Industrial Boiler Production
8.5. Supplier Relationships and Strategic Partnerships in the Industrial Boiler Market
8.6. Logistics and Distribution Challenges in Industrial Boiler Manufacturing
8.7. Role of Automation and Technology in Industrial Boiler Production
9. Industrial Boiler Market End-User & Buyer Insights
9.1. Key End-Users Driving Demand in the Industrial Boiler Market
9.2. Buyer Behaviour and Preferences in the Industrial Boiler Market
9.3. Industrial Boiler Market: End-User Insights by Sector
9.4. Factors Influencing Buyer Decisions in the Industrial Boiler Market
9.5. End-User Applications and Market Trends in Industrial Boilers
10. Industrial Boiler Market Technology & Innovation Trends
10.1. Key Technological Advancements in the Industrial Boiler Market
10.2. Innovation Trends Shaping the Future of Industrial Boilers
10.3. Smart Technologies Revolutionizing the Industrial Boiler Market
10.4. Emerging Technologies in Industrial Boilers: Efficiency & Sustainability
10.5. Impact of Automation and IoT on Industrial Boiler Performance
11. Industrial Boiler Market: Global Market Size and Forecast by Segmentation (by Value in USD Million and Volume in 000’Units) (2025-2032)
11.1. Industrial Boiler Market Size and Forecast, By Boiler Type (2025-2032)
11.1.1. Water Tube
11.1.2. Fire Tube
11.2. Industrial Boiler Market Size and Forecast, By Fuel Type (2025-2032)
11.2.1. Natural Gas and Biomass
11.2.2. Coal
11.2.3. Oil
11.2.4. Others
11.3. Industrial Boiler Market Size and Forecast, By Function (2025-2032)
11.3.1. Hot Water
11.3.2. Steam
11.4. Industrial Boiler Market Size and Forecast, By Boiler Horsepower (2025-2032)
11.4.1. Less Than 10 BHP
11.4.2. 10-150 BHP
11.4.3. 151-300 BHP
11.4.4. Greater Than 301 BHP
11.5. Industrial Boiler Market Size and Forecast, By End-Use Industry (2025-2032)
11.5.1. Chemicals & Petrochemicals
11.5.2. Food & Beverages
11.5.3. Paper & Pulp
11.5.4. Metals & Mining
11.5.5. Others
11.6. Industrial Boiler Market Size and Forecast, By Region (2025-2032)
11.6.1. North America
11.6.2. Europe
11.6.3. Asia Pacific
11.6.4. Middle East and Africa
11.6.5. South America
12. North America Industrial Boiler Market Size and Forecast by Segmentation (by Value in USD Million and Volume in 000’Units) (2025-2032)
12.1. North America Industrial Boiler Market Size and Forecast, By Boiler Type (2025-2032)
12.2. North America Industrial Boiler Market Size and Forecast, By Fuel Type (2025-2032)
12.3. North America Industrial Boiler Market Size and Forecast, By Function (2025-2032)
12.4. North America Industrial Boiler Market Size and Forecast, By Boiler Horsepower (2025-2032)
12.5. North America Industrial Boiler Market Size and Forecast, By End-Use Industry (2025-2032)
12.6. North America Industrial Boiler Market Size and Forecast, by Country (2025-2032)
12.6.1. United States
12.6.2. Canada
12.6.3. Mexico
13. Europe Industrial Boiler Market Size and Forecast by Segmentation (by Value in USD Million and Volume in 000’Units) (2025-2032)
13.1. Europe Industrial Boiler Market Size and Forecast, By Boiler Type (2025-2032)
13.2. Europe Industrial Boiler Market Size and Forecast, By Fuel Type (2025-2032)
13.3. Europe Industrial Boiler Market Size and Forecast, By Function (2025-2032)
13.4. Europe Industrial Boiler Market Size and Forecast, By Boiler Horsepower (2025-2032)
13.5. Europe Industrial Boiler Market Size and Forecast, By End-Use Industry (2025-2032)
13.6. Europe Industrial Boiler Market Size and Forecast, by Country (2025-2032)
13.6.1. United Kingdom
13.6.1.1. United Kingdom Industrial Boiler Market Size and Forecast, By Boiler Type (2025-2032)
13.6.1.2. United Kingdom Industrial Boiler Market Size and Forecast, By Fuel Type (2025-2032)
13.6.1.3. United Kingdom Industrial Boiler Market Size and Forecast, By Function (2025-2032)
13.6.1.4. United Kingdom Industrial Boiler Market Size and Forecast, By Boiler Horsepower (2025-2032)
13.6.1.5. United Kingdom Industrial Boiler Market Size and Forecast, By End-Use Industry (2025-2032)
13.6.2. France
13.6.3. Germany
13.6.4. Italy
13.6.5. Spain
13.6.6. Sweden
13.6.7. Russia
13.6.8. Rest of Europe
14. Asia Pacific Industrial Boiler Market Size and Forecast by Segmentation (by Value in USD Million and Volume in 000’Units) (2025-2032)
14.1. Asia Pacific Industrial Boiler Market Size and Forecast, By Boiler Type (2025-2032)
14.2. Asia Pacific Industrial Boiler Market Size and Forecast, By Fuel Type (2025-2032)
14.3. Asia Pacific Industrial Boiler Market Size and Forecast, By Function (2025-2032)
14.4. Asia Pacific Industrial Boiler Market Size and Forecast, By Boiler Horsepower (2025-2032)
14.5. Asia Pacific Industrial Boiler Market Size and Forecast, By End-Use Industry (2025-2032)
14.6. Asia Pacific Industrial Boiler Market Size and Forecast, by Country (2025-2032)
14.6.1. China
14.6.2. S Korea
14.6.3. Japan
14.6.4. India
14.6.5. Australia
14.6.6. Indonesia
14.6.7. Malaysia
14.6.8. Philippines
14.6.9. Thailand
14.6.10. Vietnam
14.6.11. Rest of Asia Pacific
15. Middle East and Africa Industrial Boiler Market Size and Forecast (by Value in USD Million and Volume in 000’Units) (2025-2032)
15.1. Middle East and Africa Industrial Boiler Market Size and Forecast, By Boiler Type (2025-2032)
15.2. Middle East and Africa Industrial Boiler Market Size and Forecast, By Fuel Type (2025-2032)
15.3. Middle East and Africa Industrial Boiler Market Size and Forecast, By Function (2025-2032)
15.4. Middle East and Africa Industrial Boiler Market Size and Forecast, By Boiler Horsepower (2025-2032)
15.5. Middle East and Africa Industrial Boiler Market Size and Forecast, By End-Use Industry (2025-2032)
15.6. Middle East and Africa Industrial Boiler Market Size and Forecast, by Country (2025-2032)
15.6.1. South Africa
15.6.2. GCC
15.6.3. Egypt
15.6.4. Nigeria
15.6.5. Rest of ME&A
16. South America Industrial Boiler Market Size and Forecast by Segmentation (by Value in USD Million and Volume in 000’Units) (2025-2032)
16.1. South America Industrial Boiler Market Size and Forecast, By Boiler Type (2025-2032)
16.2. South America Industrial Boiler Market Size and Forecast, By Fuel Type (2025-2032)
16.3. South America Industrial Boiler Market Size and Forecast, By Function (2025-2032)
16.4. South America Industrial Boiler Market Size and Forecast, By Boiler Horsepower (2025-2032)
16.5. South America Industrial Boiler Market Size and Forecast, By End-Use Industry (2025-2032)
16.6. South America Industrial Boiler Market Size and Forecast, by Country (2025-2032)
16.6.1. Brazil
16.6.2. Argentina
16.6.3. Colombia
16.6.4. Chile
16.6.5. Rest Of South America
17. Industrial Boiler Market Company Profile: Key Players
17.1. Daikin Industries Ltd.
17.1.1. Company Overview
17.1.2. Business Portfolio
17.1.3. Financial Overview
17.1.4. SWOT Analysis
17.1.5. Strategic Analysis
17.1.6. Recent Developments
17.2. Thermax Ltd.
17.3. Siemens AG
17.4. Bharat Heavy Electricals Ltd.
17.5. Forbes Marshall
17.6. Mitsubishi Heavy Industries Ltd.
17.7. Harbin Oil Corporation
17.8. Cheema Boilers Limited
17.9. IHI Corporation
17.10. AC Boilers
17.11. Dongfang Oil Corporation Ltd.
17.12. Cleaver?Brooks
17.13. Babcock & Wilcox Enterprises
17.14. Clayton Industries
17.15. Cochran
17.16. Doosan Heavy Industries and Construction
17.17. Bosch Industriekessel GmbH
17.18. Ekotek Kazan Ltd.
17.19. SILSON
17.20. Unilux Advanced Manufacturing, LLC
17.21. Fulton
17.22. Nationwide Boiler Inc.
17.23. Reimers Electra Steam Inc.
17.24. Victory Energy
17.25. Columbia Boiler Company
17.26. John Cockerill
17.27. Miura Co. Ltd.
17.28. Hurst Boiler & Welding Co.
17.29. Alpha Laval AB
17.30. Vyncke
18. Key Findings
19. Analyst Recommendations
20. Industrial Boiler Market: Research Methodology


