Gaming Gadgets Market - Global Market Outlook and Forecast (2026-2032) Trends, Statistics, Dynamics, Segmentation by Gadget, Product, End User, and Region
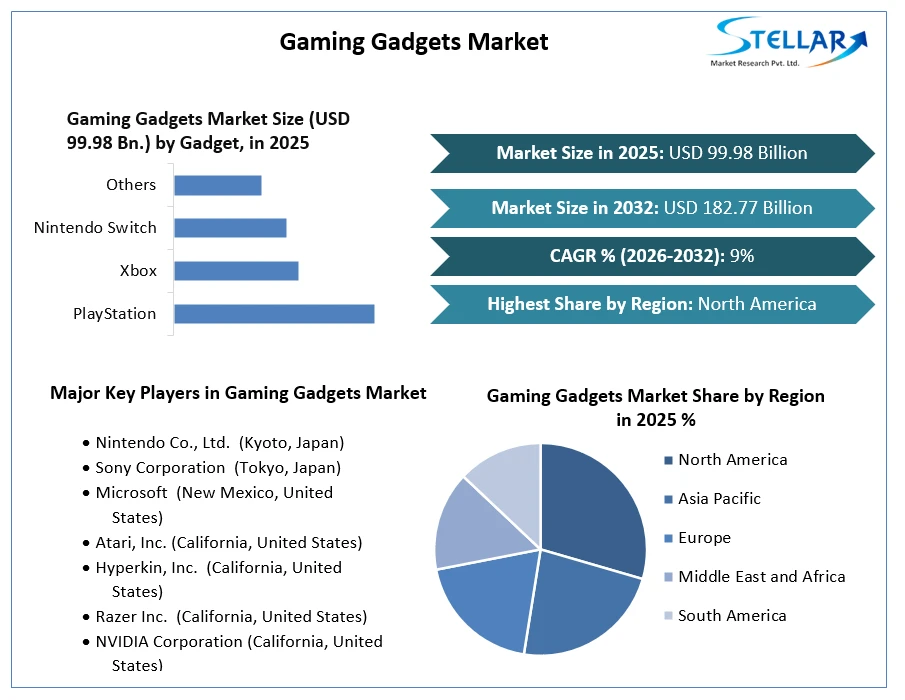
Gaming Gadgets Market was valued at USD 99.98 billion in 2025. Global Gaming Gadgets Market size is estimated to grow at a CAGR of 9% over the forecast period.
Gaming Gadgets Market Definition:
Open-source gaming portable structures that support video and music playback are known as gaming gadgets. Gaming has evolved into an incredible and adventurous platform. There is a boom in Augmented Reality (AR) and Virtual Reality (VR), and businesses are leveraging these breakthroughs to their maximum potential, resulting in tremendous industry growth. The numerous gaming genres, such as action, role play, simulation, and strategy, are attracting more customers. The gaming gadgets market report segment analysis is studied using the the segment on the basis of gadget, product, age group and region.
To get more Insights: Request Free Sample Report
Gaming Gadgets Market Dynamics:
Companies are inventing new platforms to reach gamers all over the world, and the market is growing at a breakneck pace. The increased popularity of social media gaming has had a significant impact on the market's growth. Other factors driving gaming gadgets market growth include a growing fan base for e-sports competitions and an increase in the number of professional players.
As customers adopt advanced capabilities such as record, stream, and cross-platform gameplay, there has been a significant shift in consumer tastes, which has contributed to an increase in console sales. Consumer expenditure on gaming products has increased as the degree of discretionary income has increased.
Samsung released the Odessey Neo G9 gaming monitor using quantum mini-LED technology for HDR applications in July 2025.
In India, MSI released the GP Leopard, Pulse GL, and Katana GF gaming laptops, which have 11th Gen Intel Core H-series CPUs.
Microsoft Corporation announced the release of Pulse Red wireless controllers in January 2021, which can be used to transition between Xbox consoles, PCs, and Android smartphones without having to go through the setup procedure again.
The availability of internet video gaming has increased dramatically as a result of technological improvements. Professionals in eSports must be able to stand for long periods of time, have a quick eye, quick reflexes, and nimble fingers. Because of its accessibility, the eSports business has grown in popularity.
Motion gaming ensures that on-screen movements correspond to broad gestures, actions, or vocal commands that do not necessitate the use of specific controllers. Motion gaming has been attempted by companies such as Sega Genesis, but with only mediocre success.
The key reason driving the Gaming gadgets market is the easier availability and accessibility of games on the internet, as well as the growing quantity of Internet services. Consumer expenditure on gaming items has increased as disposable income has increased, and changing consumer preferences have led to widespread adoption of powerful gaming consoles with complex features, resulting in significant market demand. The rising popularity of e-sport events and the expanding number of professional gamers will drive strong market demand.
Gaming Gadgets Market Segment Analysis:
By Gadget, PlayStation dominated the gaming gadgets market in terms of Gadget type, with 47 % share. PlayStation has revolutionized the gaming industry by delivering ground-breaking accessories, graphics, and overall functionality. A big number of gamers have been drawn by the continuous technical and system updates. Through the forecast period, Xbox and Nintendo Switch are expected to grow at a CAGR of 6 %.
By Product, Home consoles dominated the gaming gadgets market with a 70% share, and are expected to increase at a CAGR of 7.4 % through the forecast period. Home consoles are readily connected to all display devices and have tailored components to save energy and space. However, because of their improved portability and reduced cost, handheld consoles are likely to rise during the forecast period.
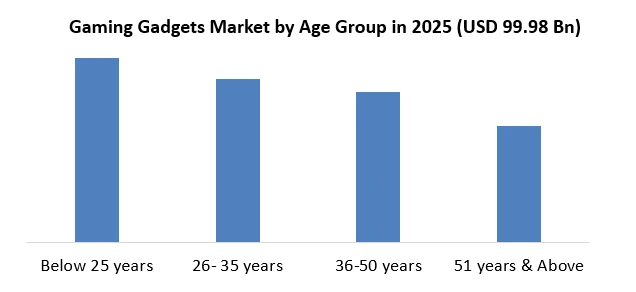
By Age Group, with 54% share, the age group under 25 years led the gaming gadgets market segment. This age group is heavily influenced by industry trends and uses games to form strong bonds. The age range 26–35 is likely to rise in the next years, as internet game streaming has become a lucrative source of revenue for this demographic.
Gaming Gadgets Market Regional Insights:
North America dominated the gaming gadgets market with 44% of the market share. With the most revolutionary technology, the market is swiftly and consistently expanding. Major considerations include the region's growing popularity as a result of the social media trend and gaming competitions with millions of dollars in prizes. Through the forecast period, this region is expected to increase at a CAGR of 7%.
China, India, and South Korea are predicted to push the Asia-Pacific market enormously through the forecast period. Because China is becoming a significant gaming hub, the Asia-Pacific market is likely to grow rapidly. The rise in online gaming tournaments and the growing number of online players in the Asia Pacific are prompting vendors to establish new platforms.
Gaming Gadgets Market Key Players Insights:
The market is characterized by the existence of a number of well-known firms. These companies control a large portion of the market, have a wide product portfolio, and have a global presence. In addition, the market comprises small to mid-sized competitors that sell a limited variety of items, some of which are self-publishing organizations.
The gaming gadgets market's major companies have a significant impact because most of them have extensive global networks through which they can reach their massive client bases. To drive revenue growth and strengthen their positions in the global market, key players in the market, particularly in Europe and North America, are focusing on strategic initiatives such as acquisitions, new collection launches, and partnerships.
The objective of the report is to present a comprehensive analysis of the Global Gaming Gadgets market to the stakeholders in the industry. The report provides trends that are most dominant in the Global Gaming Gadgets market and how these trends will influence new business investments and market development throughout the forecast period. The report also aids in the comprehension of the Global Gaming Gadgets Market dynamics and competitive structure of the market by analyzing market leaders, market followers, and regional players.
The qualitative and quantitative data provided in the Global Gaming Gadgets market report is to help understand which market segments, regions are expected to grow at higher rates, factors affecting the market, and key opportunity areas, which will drive the industry and market growth through the forecast period. The report also includes the competitive landscape of key players in the industry along with their recent developments in the Global Gaming Gadgets market. The report studies factors such as company size, market share, market growth, revenue, production volume, and profits of the key players in the global market.
The report provides Porter's Five Force Model, which helps in designing the business strategies in the market. The report helps in identifying how many rivals are existing, who they are, and how their product quality is in the Global Gaming Gadgets market. The report also analyses if the Global Gaming Gadgets market is easy for a new player to gain a foothold in the market, do they enter or exit the market regularly if the market is dominated by a few players, etc.
The report also includes a PESTEL Analysis, which aids in the development of company strategies. Political variables help in figuring out how much a government can influence the Global Gaming Gadgets market. Economic variables aid in the analysis of economic performance drivers that have an impact on the Global Gaming Gadgets market. Understanding the impact of the surrounding environment and the influence of environmental concerns on the global market is aided by legal factors.
Gaming Gadgets Market Scope:
|
Gaming Gadgets Market |
|
|
Market Size in 2025 |
USD 99.98 Bn. |
|
Market Size in 2032 |
USD 182.77 Bn. |
|
CAGR (2026-2032) |
9% |
|
Historic Data |
2020-2025 |
|
Base Year |
2025 |
|
Forecast Period |
2026-2032 |
|
Segment Scope |
By Gadget
|
|
By Product
|
|
|
By Age Group
|
|
|
Regional Scope |
North America- United States, Canada, and Mexico Europe – UK, France, Germany, Italy, Spain, Sweden, Austria, and Rest of Europe Asia Pacific – China, India, Japan, South Korea, Australia, ASEAN, Rest of APAC Middle East and Africa - South Africa, GCC, Egypt, Nigeria, Rest of the Middle East and Africa South America – Brazil, Argentina, Rest of South America |
Gaming Gadgets Market Key Players:
- Nintendo Co., Ltd. (Kyoto, Japan)
- Sony Corporation (Tokyo, Japan)
- Microsoft (New Mexico, United States)
- Atari, Inc. (California, United States)
- Hyperkin, Inc. (California, United States)
- Razer Inc. (California, United States)
- NVIDIA Corporation (California, United States)
- Valve Corp. (Washington, United States)
- Dell Technologies (Texas, United States)
- Turtle Beach (California, United States)
- Corsair Components Inc. (California, United States)
- Cooler Master Co. Ltd (Taiwan)
- HyperX (California, United States)
- SteelSeries (Denmark)
- Reddragon (Hongkong)
Frequently Asked Questions
Asia Pacific region is expected to hold the highest share in the Gaming Gadgets Market.
The market size of the Gaming Gadgets Market by 2032 is expected to reach USD 182.77 Billion.
The forecast period for the Gaming Gadgets Market is 2026-2032.
The market size of the Gaming Gadgets Market in 2025 was valued at USD 99.98 Billion.
1. Gaming Gadgets Market Introduction
1.1. Study Assumption and Market Definition
1.2. Scope of the Study
1.3. Executive Summary
2. Global Gaming Gadgets Market: Competitive Landscape
2.1. SMR Competition Matrix
2.2. Competitive Landscape
2.3. Key Players Benchmarking
2.3.1. Company Name
2.3.2. Product Segment
2.3.3. End-user Segment
2.3.4. Revenue (2025)
2.3.5. Company Locations
2.4. Market Structure
2.4.1. Market Leaders
2.4.2. Market Followers
2.4.3. Emerging Players
2.5. Mergers and Acquisitions Details
3. Gaming Gadgets Market: Dynamics
3.1. Gaming Gadgets Market Trends by Region
3.1.1. North America
3.1.2. Europe
3.1.3. Asia Pacific
3.1.4. Middle East and Africa
3.1.5. South America
3.2. Gaming Gadgets Market Dynamics
3.2.1. Gaming Gadgets Market Drivers
3.2.2. Gaming Gadgets Market Restraints
3.2.3. Gaming Gadgets Market Opportunities
3.2.4. Gaming Gadgets Market Challenges
3.3. PORTER’s Five Forces Analysis
3.4. PESTLE Analysis
3.5. Technological Roadmap
3.6. Value Chain Analysis and Supply Chain Analysis
3.7. Regulatory Landscape
3.8. Trade Analysis
3.9. Key Opinion Leaders Analysis for the Gaming Gadgets Industry
4. Gaming Gadgets Market: Global Market Size and Forecast by Segmentation (by Value in USD Bn and Volume Units) (2026-2032)
4.1. Gaming Gadgets Market Size and Forecast, by Gadget (2026-2032)
4.1.1. PlayStation
4.1.2. Xbox
4.1.3. Nintendo Switch
4.1.4. Others
4.2. Gaming Gadgets Market Size and Forecast, by Product (2026-2032)
4.2.1. Handheld Consoles
4.2.2. Home Consoles
4.3. Gaming Gadgets Market Size and Forecast, by Age Group (2026-2032)
4.3.1. Below 25 years
4.3.2. 26- 35 years
4.3.3. 36-50 years
4.3.4. 51 years & Above
4.4. Gaming Gadgets Market Size and Forecast, by Region (2026-2032)
4.4.1. North America
4.4.2. Europe
4.4.3. Asia Pacific
4.4.4. Middle East and Africa
4.4.5. South America
5. North America Gaming Gadgets Market Size and Forecast by Segmentation (by Value in USD Bn and Volume Units) (2026-2032)
5.1. North America Gaming Gadgets Market Size and Forecast, by Gadget (2026-2032)
5.1.1. PlayStation
5.1.2. Xbox
5.1.3. Nintendo Switch
5.1.4. Others
5.2. North America Gaming Gadgets Market Size and Forecast, by Product (2026-2032)
5.2.1. Handheld Consoles
5.2.2. Home Consoles
5.3. North America Gaming Gadgets Market Size and Forecast, by Age Group (2026-2032)
5.3.1. Below 25 years
5.3.2. 26- 35 years
5.3.3. 36-50 years
5.3.4. 51 years & Above
5.4. North America Gaming Gadgets Market Size and Forecast, by Country (2026-2032)
5.4.1. United States
5.4.2. Canada
5.4.3. Mexico
6. Europe Gaming Gadgets Market Size and Forecast by Segmentation (by Value in USD Bn and Volume Units) (2026-2032)
6.1. Europe Gaming Gadgets Market Size and Forecast, by Gadget (2026-2032)
6.2. Europe Gaming Gadgets Market Size and Forecast, by Product (2026-2032)
6.3. Europe Gaming Gadgets Market Size and Forecast, by Age Group (2026-2032)
6.4. Europe Gaming Gadgets Market Size and Forecast, by Country (2026-2032)
6.4.1. United Kingdom
6.4.2. France
6.4.3. Germany
6.4.4. Italy
6.4.5. Spain
6.4.6. Sweden
6.4.7. Austria
6.4.8. Rest of Europe
7. Asia Pacific Gaming Gadgets Market Size and Forecast by Segmentation (by Value in USD Bn and Volume Units) (2026-2032)
7.1. Asia Pacific Gaming Gadgets Market Size and Forecast, by Gadget (2026-2032)
7.2. Asia Pacific Gaming Gadgets Market Size and Forecast, by Product (2026-2032)
7.3. Asia Pacific Gaming Gadgets Market Size and Forecast, by Age Group (2026-2032)
7.4. Asia Pacific Gaming Gadgets Market Size and Forecast, by Country (2026-2032)
7.4.1. China
7.4.2. S Korea
7.4.3. Japan
7.4.4. India
7.4.5. Australia
7.4.6. Indonesia
7.4.7. Malaysia
7.4.8. Vietnam
7.4.9. Taiwan
7.4.10. Rest of Asia Pacific
8. Middle East and Africa Gaming Gadgets Market Size and Forecast by Segmentation (by Value in USD Bn and Volume Units) (2026-2032)
8.1. Middle East and Africa Gaming Gadgets Market Size and Forecast, by Gadget (2026-2032)
8.2. Middle East and Africa Gaming Gadgets Market Size and Forecast, by Product (2026-2032)
8.3. Middle East and Africa Gaming Gadgets Market Size and Forecast, by Age Group (2026-2032)
8.4. Middle East and Africa Gaming Gadgets Market Size and Forecast, by Country (2026-2032)
8.4.1. South Africa
8.4.2. GCC
8.4.3. Nigeria
8.4.4. Rest of ME&A
9. South America Gaming Gadgets Market Size and Forecast by Segmentation (by Value in USD Bn and Volume Units) (2026-2032)
9.1. South America Gaming Gadgets Market Size and Forecast, by Gadget (2026-2032)
9.2. South America Gaming Gadgets Market Size and Forecast, by Product (2026-2032)
9.3. South America Gaming Gadgets Market Size and Forecast, by Age Group (2026-2032)
9.4. South America Gaming Gadgets Market Size and Forecast, by Country (2026-2032)
9.4.1. Brazil
9.4.2. Argentina
9.4.3. Rest Of South America
10. Company Profile: Key Players
10.1. Nintendo Co., Ltd. (Kyoto, Japan)
10.1.1. Company Overview
10.1.2. Business Portfolio
10.1.3. Financial Overview
10.1.4. SWOT Analysis
10.1.5. Strategic Analysis
10.1.6. Recent Developments
10.2. Sony Corporation (Tokyo, Japan)
10.3. Microsoft (New Mexico, United States)
10.4. Atari, Inc. (California, United States)
10.5. Hyperkin, Inc. (California, United States)
10.6. Razer Inc. (California, United States)
10.7. NVIDIA Corporation (California, United States)
10.8. Valve Corp. (Washington, United States)
10.9. Dell Technologies (Texas, United States)
10.10. Turtle Beach (California, United States)
10.11. Corsair Components Inc. (California, United States)
10.12. Cooler Master Co. Ltd (Taiwan)
10.13. HyperX (California, United States)
10.14. SteelSeries (Denmark)
10.15. Reddragon (Hongkong)
11. Key Findings
12. Industry Recommendations
13. Gaming Gadgets Market: Research Methodology


