Asia Pacific Cable Connector Market Size, Share, Growth Trends, Industry Analysis, Key Players, Investment Opportunities, and Forecast (2025-2032)
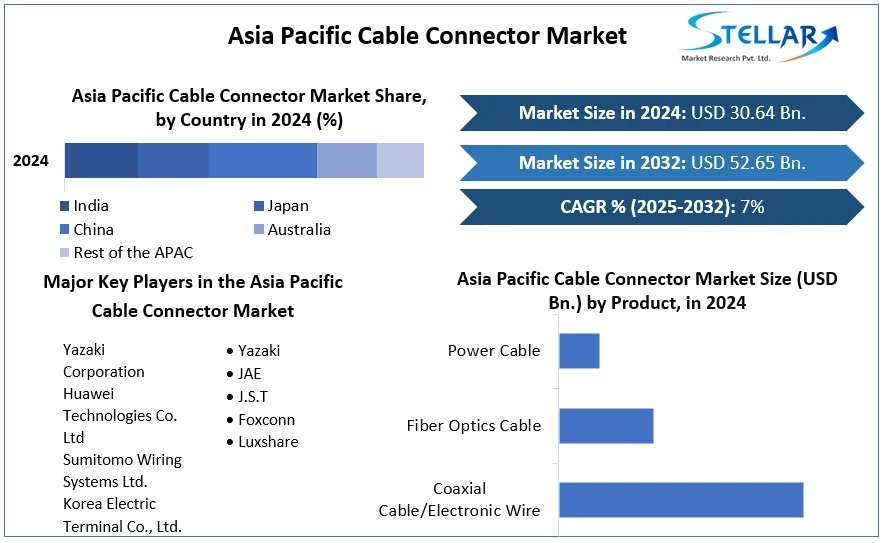
Asia Pacific Cable Connector Market size was valued at US$ 30.64 Billion in 2024 and the total Asia Pacific Cable Connector revenue is expected to grow at 7 % through 2025 to 2032, reaching nearly US$ 52.65 Billion.
Asia Pacific Cable Connector Market Overview:
When it comes to the APAC region, the Chinese cable connector market is growing the fastest than that of any other country. China’s Foxconn and Luxshare are some of the top 10 cable connector manufacturing companies in the world. The cable connectors manufactured in China are generally low-end and high-end connectors but the demand for low-end connectors is high in the country.
More than 12% of the global cable connector consumption is attributed to Japan. Some of the major cable connector manufacturers in Japan are JST, JAE, Fujitsu, etc. All of these cable connector supplier companies have engineering, manufacturing, and marketing facilities available in the Japanese mainland.
South Korea is also one of the leading manufacturers of cable connectors in the APAC region. Gigalane Co. Ltd., Isotec Corporation, LS Cable RF Total Solution, Mpdevice Company Limited are a few examples of key companies that are responsible for manufacturing RF cable connectors, coaxial cable connectors, and other cable accessories like jumpers and adapters.
To get more Insights: Request Free Sample Report
Asia Pacific Cable Connector Market Dynamics:
One of the major drivers in the APAC cable connector market is the growing demand for miniaturized cable connectors as industrial requirements to save more space on general-purpose PCBs.Growing smartphone consumption in APAC countries created the need for PCBs to accommodate more and more transistors. This additional space required for transistors can be compensated by miniaturizing the size of PCB connectors. The ever-increasing demand for USB cable connectors in countries with high smartphone consumption e.g. India and China is also one of the major drivers in the APAC cable connector market.
A restraint in the APAC cable connector market is the unavailability of raw materials. Steel and copper cable manufacturers are already facing shortages of raw materials which resulted in increased prices and production slowdown.In the Indian market, the unavailability of raw materials has caused many steel cable producers to operate at low capacity and are on the verge of closing down if the lack of supply continues.
Asia Pacific Cable Connector Market Segment Analysis:
By Product, the coaxial cable segment dominated the APAC market in 2024. This segment is also expected to grow at the highest CAGR of 6.3% in the forecast period (2025-2032). The rapid adoption of 5G and IoT is the primary reason for the growth of the coaxial cable connector segment. China is the leading producer and consumer of coaxial cables in the APAC region.One of the major Chinese coaxial cable companies are Zhejiang Shengyang Science and Technology, Zhongtian RF Cable, etc. The fiber optics cable connector segment is expected to follow the coaxial cable segment in terms of growth. It is expected to grow at the CAGR of 5.8% in the same forecast period. This can be attributed to multi-mode fiber optic cables having high demand in countries like Korea and China.

By Vertical, the Industrial and Manufacturing segment is expected to dominate the APAC market in 2032. This can be attributed to China having the highest industrial manufacturing output in the world with over 30% of the world total. The top exporting products of the Chinese market include Broadcasting equipment, computers, Integrated Circuits, and telephones.All of these are the key subsets of the cable connector market. IT & Telecom segment is expected to grow at the CAGR of 5.9% in the APAC cable connector market. Energy & Power is expected to hold a significant share in the APAC cable connector market at the end of the aforementioned forecast period.It can be attributed to high exports of electrical power accessories of countries like China and Japan. In September 2021, China’s electrical power accessories exports were worth US$ 450 million.
Asia Pacific Cable Connector Market Regional Insights:
The Australian cable connector market is expected to grow at a significant CAGR of 7.8% in the aforementioned forecast period. This can be correlated with high import rates of broadcasting equipment within the country. (US$ 6.3billlion in 2020). The key region in terms of overall growth in the APAC market is expected to be South Korea. The primary reason behind this is the fact that South Korea is one of the largest Integrated Circuits exporting countries in the world with US$ 90 billion worth of exports in 2020 alone. These exports are expected to drive the growth of the PCB cable connector segment in the APAC region in the same forecast period.
The purpose of this research is to provide stakeholders in the industry with a thorough insight into the Asia Pacific Cable Connector market. The study includes an analysis of difficult data in simple language, as well as the industry's historical and current state, as well as anticipated market size and trends.The analysis examines all areas of the industry, with a focus on significant companies such as market leaders, followers, and newcomers.
The research includes a PORTER, PESTEL analysis as well as the possible influence of microeconomic market determinants. External and internal elements that are expected to have a favorable or negative impact on the firm have been examined, providing decision-makers with a clear future vision of the industry.The research also aids in comprehending the Asia Pacific Cable Connector market dynamics and structure by studying market segments and forecasting market size.The research is an investor's guide since it depicts the competitive analysis of major competitors in the Asia Pacific Cable Connector market by product, price, financial situation, product portfolio, growth plans, and geographical presence.
Asia Pacific Cable Connector Market Scope:
|
Asia Pacific Cable Connector Market |
|
|
Market Size in 2024 |
USD 30.64 Bn. |
|
Market Size in 2032 |
USD 52.65 Bn. |
|
CAGR (2025-2032) |
7% |
|
Historic Data |
2019-2024 |
|
Base Year |
2024 |
|
Forecast Period |
2025-2032 |
|
Segment Scope |
By Product
|
|
By Vertical
|
|
|
Country Scope |
China India Japan South Korea Australia ASEAN Rest of APAC |
Asia Pacific Cable Connector Market Players:
-
Yazaki Corporation
-
Huawei Technologies Co. Ltd
-
Sumitomo Wiring Systems Ltd.
-
Yazaki
-
JAE
-
J.S.T
-
Luxshare
Frequently Asked Questions
The Australian cable connector market is expected to grow at a significant CAGR of 7% in the aforementioned forecast period
One of the major drivers in the APAC cable connector market is the growing demand for miniaturized cable connectors as industrial requirements to save more space on general-purpose PCBs
When it comes to the APAC region, the Chinese cable connector market is growing the fastest than that of any other country in the APAC region.
Scope of the Report
Chapter 2 Research Methodology
2.1.Research Process
2.2.Asia Pacific Cable Connector Market: Target Audience
2.3.Asia Pacific Cable Connector Market: Primary Research (As per Client Requirement)
2.4.Asia Pacific Cable Connector Market: Secondary Research
Chapter 3 Executive Summary
Chapter 4 Competitive Landscape
4.1. Market Share Analysis, By Value, 2024-2032
4.1.1. Market Share Analysis, By Region, By Value, 2024-2032 (In %)
4.1.1.1.Asia Pacific Market Share Analysis, By Value, 2024-2032 (In %)
4.1.2. Market Share Analysis, By Product, By Value, 2024-2032 (In %)
4.1.2.1.Asia Pacific Market Share Analysis, By Product, By Value, 2024-2032 (In %)
4.1.2.1.1.China Market Share Analysis, By Product, By Value, 2024-2032 (In %)
4.1.2.1.2.India Market Share Analysis, By Product, By Value, 2024-2032 (In %)
4.1.2.1.3.Japan Market Share Analysis, By Product, By Value, 2024-2032 (In %)
4.1.2.1.4.South Korea Market Share Analysis, By Product, By Value, 2024-2032 (In %)
4.1.2.1.5.Australia Market Share Analysis, By Product, By Value, 2024-2032 (In %)
4.1.2.1.6.ASEAN Market Share Analysis, By Product, By Value, 2024-2032 (In %)
4.1.2.1.7.Rest of APAC Market Share Analysis, By Product, By Value, 2024-2032 (In %)
4.1.3. Market Share Analysis, By Type, By Value, 2024-2032 (In %)
4.1.3.1. Asia Pacific Market Share Analysis, By Type, By Value, 2024-2032 (In %)
4.1.3.1.1.China Market Share Analysis, By Type, By Value, 2024-2032 (In %)
4.1.3.1.2.India Market Share Analysis, By Type, By Value, 2024-2032 (In %)
4.1.3.1.3.Japan Market Share Analysis, By Type, By Value, 2024-2032 (In %)
4.1.3.1.4.South Korea Market Share Analysis, By Type, By Value, 2024-2032 (In %)
4.1.3.1.5.Australia Market Share Analysis, By Type, By Value, 2024-2032 (In %)
4.1.3.1.6.ASEAN Market Share Analysis, By Type, By Value, 2024-2032 (In %)
4.1.3.1.7.Rest of APAC Market Share Analysis, By Type, By Value, 2024-2032 (In %)
4.1.4. Market Share Analysis, By Vertical, By Value, 2024-2032 (In %)
4.1.4.1.Asia Pacific Market Share Analysis, By Vertical, By Value, 2024-2032 (In %)
4.1.4.1.1.China Market Share Analysis, By Vertical, By Value, 2024-2032 (In %)
4.1.4.1.2.India Market Share Analysis, By Vertical, By Value, 2024-2032 (In %)
4.1.4.1.3.Japan Market Share Analysis, By Vertical, By Value, 2024-2032 (In %)
4.1.4.1.4.South Korea Market Share Analysis, By Vertical, By Value, 2024-2032 (In %)
4.1.4.1.5.Australia Market Share Analysis, By Vertical, By Value, 2024-2032 (In %)
4.1.4.1.6.ASEAN Market Share Analysis, By Vertical, By Value, 2024-2032 (In %)
4.1.4.1.7.Rest of APAC Market Share Analysis, By Vertical, By Value, 2024-2032 (In %)
4.2. Stellar Competition matrix
4.2.1.Asia Pacific Stellar Competition Matrix
4.3. Key Players Benchmarking
4.3.1.Key Players Benchmarking by Product, Pricing, Market Share, Investments, Expansion Plans, Physical Presence, and Presence in the Market.
4.4. Mergers and Acquisitions in Industry
4.4.1.M&A by Region, Value, and Strategic Intent
4.5. Market Dynamics
4.5.1.Market Drivers
4.5.2.Market Restraints
4.5.3.Market Opportunities
4.5.4.Market Challenges
4.5.5.PESTLE Analysis
4.5.6.PORTERS Five Force Analysis
4.5.7.Value Chain Analysis
Chapter 5 Asia Pacific Cable Connector Market Segmentation: By Product
5.1. Asia Pacific Cable Connector Market, By Product, Overview/Analysis, 2024-2032
5.2. Asia Pacific Cable Connector Market, By Product, By Value, Market Share (%), 2024-2032 (USD Billion)
5.3. Asia Pacific Cable Connector Market, By Product, By Value,
5.3.1.Coaxial Cable/Electronic Wire
5.3.2.Fiber Optics Cable
5.3.3.Power Cable
5.3.4.Signal and Control Cable
5.3.5.Telecom and Data Cable
Chapter 6 Asia Pacific Cable Connector Market Segmentation: By Type
6.1. Asia Pacific Cable Connector Market, By Type, Overview/Analysis, 2024-2032
6.2. Asia Pacific Cable Connector Market Size, By Type, By Value, Market Share (%), 2024-2032 (USD Billion)
6.3. Asia Pacific Cable Connector Market, By Type, By Value,
6.3.1.PCB Connectors
6.3.2.Circular/Rectangular Connectors
6.3.3.Fiber Optic Connectors
6.3.4.IO Connectors
Chapter 7 Asia Pacific Cable Connector Market Segmentation: By Vertical
7.1. Asia Pacific Cable Connector Market, By Vertical, Overview/Analysis, 2024-2032
7.2. Asia Pacific Cable Connector Market Size, By Vertical, By Value, Market Share (%), 2024-2032 (USD Billion)
7.3. Asia Pacific Cable Connector Market, By Vertical, By Value,
7.3.1.IT & Telecommunication
7.3.2.Automotive
7.3.3.Aerospace & defense
7.3.4.Consumer Electronics
7.3.5.Industrial and Manufacturing
7.3.6.Energy & Power
7.3.7.Oil & Gas
Chapter 8 Asia Pacific Cable Connector Market Segmentation: By Region
8.1. Asia Pacific Cable Connector Market Size, By Value, 2024-2032 (USD Billion)
8.1.1.China
8.1.2.India
8.1.3.Japan
8.1.4.South Korea
8.1.5.Australia
8.1.6.ASEAN
8.1.7.Rest of APAC
Chapter 9 Company Profiles
9.1. Key Players
9.1.1. Yazaki Corporation
9.1.1.1.Company Overview
9.1.1.2.Product Portfolio
9.1.1.3.Financial Overview
9.1.1.4.Business Strategy
9.1.1.5.Key Developments
9.1.2.Huawei Technologies Co. Ltd
9.1.3.Sumitomo Wiring Systems Ltd.
9.1.4.Korea Electric Terminal Co., Ltd.
9.1.5.Yazaki
9.1.6.JAE
9.1.7.J.S.T
9.1.8.Foxconn
9.1.9.Luxshare
9.2. Key Findings
9.3. Recommendations