Aerial Imaging Market Global Industry Analysis and Forecast (2026-2032) by Application, End-User, and Region
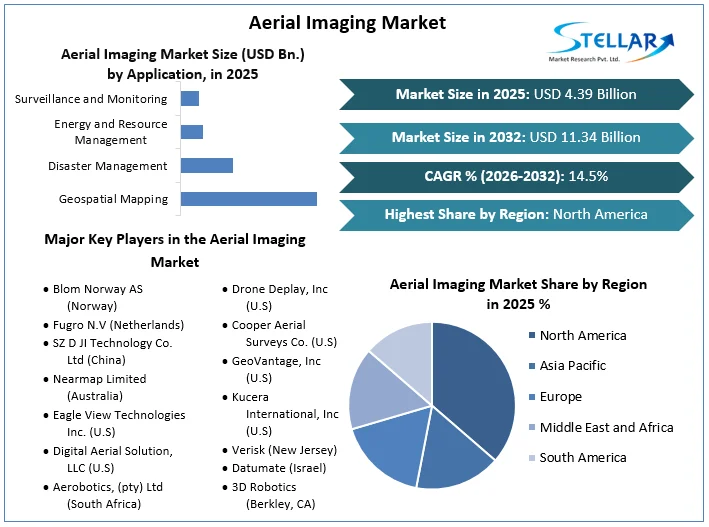
The Aerial Imaging Market size was valued at US$ 4.39 Bn in 2025. The Global Aerial Imaging Market is estimated to grow at a CAGR of 14.5% over the forecast period.
Aerial Imaging Market Definition:
The shooting of images from an aircraft or other airborne platforms is known as aerial photography or airborne imaging. Aerial videography is another term for taking motion photos from the air. Aerial imaging market inclueds, taking photos of ground surfaces from vehicles such as helicopters, parachutes, planes, kites, unmanned aerial vehicles (UAVs), balloons, vehicle-mounted poles, and airships using cameras connected to them.
Risk mitigation, resource planning, mapping, research & excavation, security and surveillance, urban planning, engineering, farming management, tourism, and other applications benefit from aerial imagery. The use of GPS and inertial technology to build a thorough and accurate three dimensional set of points, or 3D point cloud models, is gaining popularity in the industrial world.
To get more Insights: Request Free Sample Report
Aerial Imaging Market Dynamics:
The construction industry is expected to expand significantly which is driving the growth of the aerial imaging market:
In the construction sector, aerial imaging platforms such as drones or unmanned aerial vehicles (UAVs) assist builders in surveying the site by providing high-resolution photographs and topographic data that are deemed very accurate. This thorough data assists engineers in estimating project costs, as well as reducing cost overruns by establishing a solid project and using good time management.
Aerial imagery also provides a secure platform for site inspection, offering real-time data from potentially unsafe regions and assisting contractors in resolving issues before they become more serious. Contractors and site managers can obtain actionable information and visual collateral that leads to better business decisions throughout the construction process by using aerial imaging in construction projects. Thus this factor is driving the growth of the aerial imaging market.
User’s security and privacy concerns may hamper the expansion of the aerial imaging market:
Drone technology had inherent security and privacy vulnerabilities due to its design. Privacy leakage, data confidentiality, data protection, data flexibility, data accessibility, and data encryption and decryption procedures are the major restraining factor recognised in the realm of IoD security. Under the law, a UAV flying overhead and capturing images might not be infringing anyone's privacy.
Aerial Imaging Start-ups are Getting More Money which is creating a huge opportunity for the market:
Increased investment in new aerial imaging businesses, notably for drones, has resulted from the aerial imaging market potential. Ceres Imaging, an aerial spectral imagery firm that helps farmers address problems with a unique combination of hardware and agriculture experience, has acquired $5 million in funding from Romulus Capital. Geospatial insight, situated in Birmingham, delivers information and intelligence via aerial and satellite photography and has secured £1.68 million in funding to develop its capabilities. Bird, a Glasgow-based company founded by a French entrepreneur with experience managing earth observation satellites, has received £210,000 in RSA funding from Scottish Enterprise. During the forecast period, technical developments as a consequence of the financing provided to these start-ups will boost aerial imaging market growth.
Commercial Use of Drones for Aerial Imaging is Prohibited which is a significant commercial challenge:
Because of privacy and terrorist concerns, most countries prohibit the commercial use of drones or the capture of aerial imagery. The market's growth is projected to be slowed as a result of this. Consumer drones are subject to navigable airspace laws, which will smother industry growth, notably in the United States. The FAA's restrictions need to be drastically reduced and modified to reflect the numerous benefits and very low risks connected with drone technology and thus due to these factors it is considered as the major challenging factor for the aerial imaging market.
Aerial Imaging Market Segment Analysis:
By Application, the market is segmented as Geospatial Mapping, Disaster Management, Energy and Resource Management, Surveillance and Monitoring & Others. The Geospatial Mapping segment dominated the aerial imaging market with a 32.1% share in 2025. Geography and mapping are two types of geographical data. It is locational or place-based information. It is the accurate collection, storage, retrieval, and display of enormous volumes of information in a spatial context using the global positioning system (GPS) and geographic information systems (GIS).
However, the Surveillance and Monitoring segment is expected to grow at a CAGR of 7.6% through the forecast period. Monitoring is a broad phrase that describes the systematic, ongoing, active or passive observation of people, places, things, or processes. Surveillance is the monitoring of people suspected of committing crimes or other civil wrongdoings in a targeted manner. This segment may be highly utilised in the government department.

By End-User, the market is segmented as Government, Energy, Defense, Agriculture & Forestry and Others. The Agriculture & Forestry segment dominated the aerial imaging market with a 45.3% share in 2025. To address the current issues in agriculture and forestry, there is a considerable need for forest and crop monitoring. Near-real-time monitoring is essential for responding to extreme occurrences, such as climate change or pest infestations, and minimising their impact, as well as optimising management approaches, such as precision agriculture, sustainably.
However, Government is using a variety of Aerial Imaging which includes Land mapping, environmental protection, disaster management, GIS updates, urban development, homeland security, and public safety are all examples of this. However, the Energy segment is predicted to grow at the fastest rate of 13%. This is because it allows businesses to monitor construction projects in real-time.
Aerial Imaging Market Regional Insights:
The North American region dominated the market with a 40% share in 2025. Because of the presence of large providers in the region, the North American aerial imaging market is expected to dominate globally. In addition, the growing application of aerial imaging technology in a variety of end-user sectors is boosting market share in the North American region. In addition, the use of novel platforms such as drones and unmanned aerial vehicles (UAVs) to collect the essential data from a high-resolution aerial image is expected to boost market adoption in the region. Apart from this the US military and civil government are increasing the number of missions involving unmanned aerial systems, or drones. The Federal Aviation Administration (FAA) developed six UAS test sites as well as the Unmanned Aircraft Systems Center of Excellence. Through the Focus Area Pathfinder effort, the FAA is also planning partnerships with the technology industry.
However, the Asia Pacific region is expected to grow at a CAGR of 8.6% through the forecast period. The market in this region would be boosted by emerging economies and a strong presence of manufacturers in Japan, China, and India. The increase in defence spending, the fact that China and Japan have a larger market with better technology, and the region's growing popularity of smart cities, as well as increased investment in the geospatial industry, will provide more opportunities in the aerial imaging market.
The objective of the report is to present a comprehensive analysis of the Global Aerial Imaging market to the stakeholders in the industry. The report provides trends that are most dominant in the Global Aerial Imaging market and how these trends will influence new business investments and market development throughout the forecast period. The report also aids in the comprehension of the global market dynamics and competitive structure of the market by analyzing market leaders, market followers, and regional players.
The qualitative and quantitative data provided in the Global Aerial Imaging market report is to help understand which market segments, regions are expected to grow at higher rates, factors affecting the market, and key opportunity areas, which will drive the industry and market growth through the forecast period. The report also includes the competitive landscape of key players in the industry along with their recent developments in the Global Aerial Imaging market. The report studies factors such as company size, market share, market growth, revenue, production volume, and profits of the key players in the global market
The report provides Porter's Five Force Model, which helps in designing the business strategies in the market. The report helps in identifying how many rivals are existing, who they are, and how their product quality is in the Global Aerial Imaging market. The report also analyses if the Global Aerial Imaging market is easy for a new player to gain a foothold in the market, do they enter or exit the market regularly if the market is dominated by a few Players, etc.
The report also includes a PESTEL Analysis, which aids in the development of company strategies. Political variables help in figuring out how much a government can influence the Global Aerial Imaging market. Economic variables aid in the analysis of economic performance drivers that have an impact on the Global Aerial Imaging market. Understanding the impact of the surrounding environment and the influence of environmental concerns on the global market is aided by legal factors.
Aerial Imaging Market Scope:
|
Aerial Imaging Market |
|
|
Market Size in 2025 |
USD 4.39 Bn. |
|
Market Size in 2032 |
USD 11.34 Bn. |
|
CAGR (2026-2032) |
14.5% |
|
Historic Data |
2020 - 2025 |
|
Base Year |
2025 |
|
Forecast Period |
2026 - 2032 |
|
Segment Scope |
by Application
|
|
by End-User
|
|
|
Regional Scope |
North America- United States, Canada, and Mexico Europe – UK, France, Germany, Italy, Spain, Sweden, Austria, and Rest of Europe Asia Pacific – China, India, Japan, South Korea, Australia, ASEAN, Rest of APAC Middle East and Africa - South Africa, GCC, Egypt, Nigeria, Rest of the Middle East and Africa South America – Brazil, Argentina, Rest of South America |
Aerial Imaging Market Key Players:
- Blom Norway AS (Norway)
- Fugro N.V (Netherlands)
- SZ D JI Technology Co. Ltd (China)
- Nearmap Limited (Australia)
- Eagle View Technologies Inc. (U.S)
- Digital Aerial Solution, LLC (U.S)
- Aerobotics, (pty) Ltd (South Africa)
- Drone Deplay, Inc (U.S)
- Cooper Aerial Surveys Co. (U.S)
- GeoVantage, Inc (U.S)
- Kucera International, Inc (U.S)
- Verisk (New Jersey)
- Datumate (Israel)
- 3D Robotics (Berkley, CA)
- PrecisionHawk (Raleigh, NC)
Frequently Asked Questions
The North American region is expected to hold the highest share in the Aerial Imaging Market.
The market size of the Aerial Imaging Market is expected to be 11.34 Bn by 2032.
The forecast period for the Aerial Imaging Market is 2026-2032
The market size of the Aerial Imaging Market in 2025 was US$ 4.39 Bn.
1. Research Methodology
1.1 Research Data
1.1.1. Primary Data
1.1.2. Secondary Data
1.2. Market Size Estimation
1.2.1. Bottom-Up Approach
1.2.2. Top-Down Approach
1.3. Market Breakdown and Data Triangulation
1.4. Research Assumption
2. Aerial Imaging Market Executive Summary
2.1. Market Overview
2.2. Market Size (2025) and Forecast (2026– 2032) and Y-O-Y%
2.3. Market Size (USD) and Market Share (%) – By Segments and Regions
3. Aerial Imaging Market: Competitive Landscape
3.1. SMR Competition Matrix
3.2. Key Players Benchmarking
3.2.1. Company Name
3.2.2. Headquarter
3.2.3. Business Segment
3.2.4. End-user Segment
3.2.5. Y-O-Y%
3.2.6. Revenue (2025)
3.2.7. Company Locations
3.3. Market Structure
3.3.1. Market Leaders
3.3.2. Market Followers
3.3.3. Emerging Players
3.4. Consolidation of the Market
3.4.1. Strategic Initiatives
3.4.2. Mergers and Acquisitions
3.4.3. Collaborations and Partnerships
3.4.4. Developments and Innovations
4. Aerial Imaging Market: Dynamics
4.1. Aerial Imaging Market Trends by Region
4.1.1. North America
4.1.2. Europe
4.1.3. Asia Pacific
4.1.4. Middle East and Africa
4.1.5. South America
4.2. Aerial Imaging Market Drivers
4.3. Aerial Imaging Market Restraints
4.4. Aerial Imaging Market Opportunities
4.5. Aerial Imaging Market Challenges
4.6. PORTER’s Five Forces Analysis
4.6.1. Intensity of the Rivalry
4.6.2. Threat of New Entrants
4.6.3. Bargaining Power of Suppliers
4.6.4. Bargaining Power of Buyers
4.6.5. Threat of Substitutes
4.7. PESTLE Analysis
4.7.1. Political Factors
4.7.2. Economic Factors
4.7.3. Social Factors
4.7.4. Technological Factors
4.7.5. Legal Factors
4.7.6. Environmental Factors
4.8. Technological Analysis
4.8.1. Artificial intelligence in Imaging
4.8.2. LiDAR
4.8.3. Technological Roadmap
4.9. Regulatory Landscape
4.9.1. Market Regulation by Region
4.9.1.1. North America
4.9.1.2. Europe
4.9.1.3. Asia Pacific
4.9.1.4. Middle East and Africa
4.9.1.5. South America
4.9.2. Impact of Regulations on Market Dynamics
4.9.3. Government Schemes and Initiatives
5. Aerial Imaging Market: Global Market Size and Forecast by Segmentation (by Value in USD Million) (2025-2032)
5.1. Aerial Imaging Market Size and Forecast, by Application (2025-2032)
5.1.1. Geospatial Mapping
5.1.2. Disaster Management
5.1.3. Energy and Resource Management
5.1.4. Surveillance and Monitoring
5.1.5. Others
5.2. Aerial Imaging Market Size and Forecast, by End-User (2025-2032)
5.2.1. Government
5.2.2. Energy
5.2.3. Defense
5.2.4. Agriculture & Forestry
5.2.5. Others
5.3. Aerial Imaging Market Size and Forecast, by Region (2025-2032)
5.3.1. North America
5.3.2. Europe
5.3.3. Asia Pacific
5.3.4. Middle East and Africa
5.3.5. South America
6. North America Aerial Imaging Market Size and Forecast by Segmentation (by Value in USD Million) (2025-2032)
6.1. North America Aerial Imaging Market Size and Forecast, by Application (2025-2032)
6.1.1. Geospatial Mapping
6.1.2. Disaster Management
6.1.3. Energy and Resource Management
6.1.4. Surveillance and Monitoring
6.1.5. Others
6.2. North America Aerial Imaging Market Size and Forecast, by End-User (2025-2032)
6.2.1. Government
6.2.2. Energy
6.2.3. Defense
6.2.4. Agriculture & Forestry
6.2.5. Others
6.3. North America Aerial Imaging Market Size and Forecast, by Country (2025-2032)
6.3.1. United States
6.3.2. Canada
6.3.3. Mexico
7. Europe Aerial Imaging Market Size and Forecast by Segmentation (by Value in USD Million) (2025-2032)
7.1. Europe Aerial Imaging Market Size and Forecast, by Application (2025-2032)
7.2. Europe Aerial Imaging Market Size and Forecast, by End-User (2025-2032)
7.3. Europe Aerial Imaging Market Size and Forecast, by Country (2025-2032)
7.3.1. United Kingdom
7.3.2. France
7.3.3. Germany
7.3.4. Italy
7.3.5. Spain
7.3.6. Sweden
7.3.7. Austria
7.3.8. Rest of Europe
8. Asia Pacific Aerial Imaging Market Size and Forecast by Segmentation (by Value in USD Million) (2025-2032)
8.1. Asia Pacific Aerial Imaging Market Size and Forecast, by Application (2025-2032)
8.2. Asia Pacific Aerial Imaging Market Size and Forecast, by End-User (2025-2032)
8.3. Asia Pacific Aerial Imaging Market Size and Forecast, by Country (2025-2032)
8.3.1. China
8.3.2. S Korea
8.3.3. Japan
8.3.4. India
8.3.5. Australia
8.3.6. Indonesia
8.3.7. Malaysia
8.3.8. Vietnam
8.3.9. Taiwan
8.3.10. Rest of Asia Pacific
9. Middle East and Africa Aerial Imaging Market Size and Forecast by Segmentation (by Value in USD Million) (2025-2032)
9.1. Middle East and Africa Aerial Imaging Market Size and Forecast, by Application (2025-2032)
9.2. Middle East and Africa Aerial Imaging Market Size and Forecast, by End-User (2025-2032)
9.3. Middle East and Africa Aerial Imaging Market Size and Forecast, by Country (2025-2032)
9.3.1. South Africa
9.3.2. GCC
9.3.3. Nigeria
9.3.4. Rest of ME&A
10. South America Aerial Imaging Market Size and Forecast by Segmentation (by Value in USD Million) (2025-2032)
10.1. South America Aerial Imaging Market Size and Forecast, by Application (2025-2032)
10.2. South America Aerial Imaging Market Size and Forecast, by End-User (2025-2032)
10.3. South America Aerial Imaging Market Size and Forecast, by Country (2025-2032)
10.3.1. Brazil
10.3.2. Argentina
10.3.3. Rest Of South America
11. Company Profile: Key Players
11.1. Blom Norway AS (Norway)
11.1.1. Company Overview
11.1.2. Business Portfolio
11.1.3. Financial Overview
11.1.3.1. Total Revenue
11.1.3.2. Segment Revenue
11.1.3.3. Regional Revenue
11.1.4. SWOT Analysis
11.1.5. Strategic Analysis
11.1.6. Recent Developments
11.2. Fugro N.V (Netherlands)
11.3. SZ D JI Technology Co. Ltd (China)
11.4. Nearmap Limited (Australia)
11.5. Eagle View Technologies Inc. (U.S)
11.6. Digital Aerial Solution, LLC (U.S)
11.7. Aerobotics, (pty) Ltd (South Africa)
11.8. Drone Deplay, Inc (U.S)
11.9. Cooper Aerial Surveys Co. (U.S)
11.10. GeoVantage, Inc (U.S)
11.11. Kucera International, Inc (U.S)
11.12. Verisk (New Jersey)
11.13. Datumate (Israel)
11.14. 3D Robotics (Berkley, CA)
11.15. PrecisionHawk (Raleigh, NC)
12. Key Findings
13. Analyst Recommendations
13.1. Strategic Recommendations
13.2. Future Outlook


