United States Bike Sharing Market Industry Overview, Size, Share, Growth Trends, Research Insights and Forecast (2025–2032)
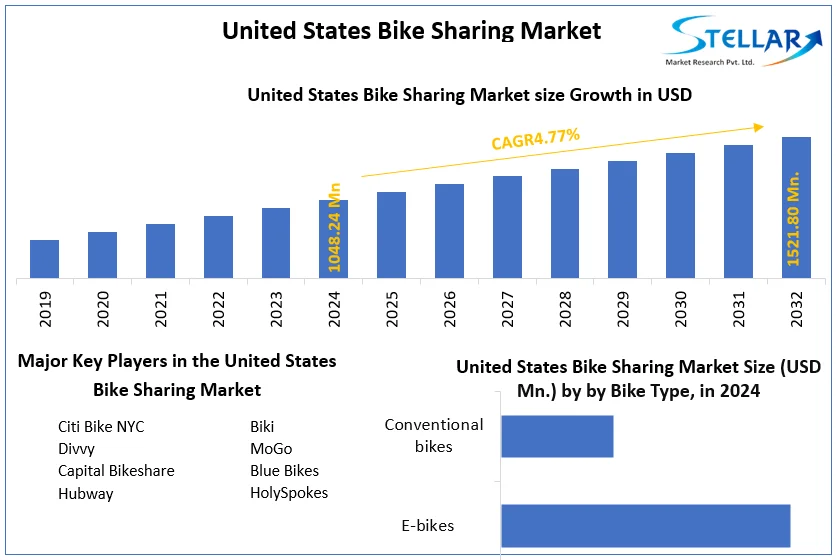
United States Bike Sharing Market size was valued at US$ 1048.24 Million in 2024 and the total United States Bike Sharing Market revenue is expected to grow at 4.77% through 2025 to 2032, reaching nearly US$ 1521.80 Million.
United States Bike Sharing Market Overview:
In 2019, people in the United States took 136 million trips on shared bikes, e-bikes, and scooters, 60% more than 2018. In total, since 2010, people in the U.S. have taken 342 million trips on shared bikes and scooters. In 2019, people took 40 million trips on station-based bike share systems (pedal & e-bikes) and 96 million trips on dockless e-bikes (10M trips) and scooters (86M trips). In 2019, 109 cities had dockless scooter programs, a 45% increase from 2018. This contributed to an over 100% increase in trips taken on scooters nationwide. Scooter expansion was in some cases unstable, with scooter companies exiting markets at the end of the year (prior to the pandemic), possibly due to over-competition and other market pressures.
To get more Insights: Request Free Sample Report
United States Bike Sharing Market Dynamics:
The number of systems decreased by 4% to 72, but the total number of bicycle-sharing riders stationed increased by 10%. The increase in passenger numbers using the bicycle sharing system was primarily due to the largest and most established bicycle sharing system. With six of the largest bike sharing systems, riders have traveled 17% more than in 2018. In Boston, for example, the city has expanded its blue bike system by 540 units, adding 50 stations and increasing passenger numbers by 45%. Smaller systems didn't get the same benefits. Driven by the largest system, the number of bike-sharing riders increased overall, but 75% of the system reduced the number of riders. When it comes to station bikes, and to a lesser extent scooters, most of the travel is mostly concentrated in some cities. In 2019, 87% of nationwide rides on docked bike sharing systems will be in the top six cities / regions (Bay Area, Boston, Massachusetts, Chicago, Illinois, Honolulu, HI, New York, New York, and Washington. It was done in DC). Although scooter, 38% of all scooter shared trips still account for six busy cities (Atlanta, Georgia, Austin, Texas, Dallas, Texas, Los Angeles, CA, San Diego, CA, and Washington DC)
Bike and scooter share tours are short. Shared micromobility provides people with more opportunities for short trips. On average, a typical scooter or cyclist with an annual / monthly pass travels 1112 minutes and 11.5 miles. These short trips are important. According to the National Household Travel Survey, 35% of all car trips in the United States are less than two miles. Building or supporting robust shared micromobility options will help people make these trips without resorting to private cars or taxis that cause traffic congestion and cause climate change. Short shared micromobility trips are local transportation by increasing the number of people who can be serviced from each stop without problems, or by providing local transportation passengers with the opportunity to avoid train transfers and congestion. It can also complement the institution. As mentioned in the Shared Micromobility Snapshot 2018, there is a clear difference in bike participation between annual / monthly ticket owners and extra / single / day ticket drivers. Using data from Washington, D.C., Boston, Massachusetts, Chicago, Illinois, San Francisco, CA, and New York, NY, the average travel time for casual drivers is 26 minutes, compared to 11 minutes for annual pass holders. Interestingly, New York City's annual pass holders travel about eight minutes, well below the national average. Bicycle and scooter vehicles are replacing car vehicles.
Currently, there is no industry-wide survey on mode switching, but survey data shows that people are using shared micromobility instead of car vehicles. Suggests. 45% of users in Santa Monica, CA, Alexandria, CA, Bloomington, Massachusetts, Hoboken, New Jersey, Oakland, CA, and San Francisco, CA instead use travel without a shared dockless scooter. He says he couldn't. Closed by passengers or hail cars. The second most frequently reported alternative to shared micromobility travel was 28% on foot and 9% by transportation. Similarly, 55% of respondents to Capital Bikeshare's 2016 annual survey said they had less frequent driving since joining CaBi, and 65% said they had less taxi use.
User Prices Vary:
Throughout the year, prices generally increased for dockless e-bike and scooter systems. Throughout 2019, users went from paying $0.15 per minute to a range of $0.15 to $0.39 per minute, in addition to the standard $1.00 unlocking fee, depending on the company. The average 12 minute scooter share trip costs $2.80 to $4.70 depending on the system.
For station-base bike share, prices have remained more constant. Most station based systems use a membership model, with unlimited monthly or annual passes available ranging from $100-$160/year, as well as single-ride options. In 2019, some station-based systems introduced new pricing structures for e-bike use. In New York City, for example, members are charged an additional $0.10 per minute, and non-members pay an additional $0.15 per minute for e-bike rentals. (There are no additional fees for standard pedal bikes, nor for e-bike use if it’s the last bike available in a station).
Cities continue to formalize shared micromobility to create better public outcomes:
In 2019, cities increasingly turned to formal requests-for-proposals (RFPs) and competitive application processes to select and manage shared micromobility programs on city streets. This formalization has helped cities improve service quality, ensure better community relations, and create a more predictable market landscape for operators. As of December 2019, 21 of the 50 largest U.S. cities have used RFPs or some other competitive application process to determine which companies, and how many, are permitted to operate—a 60% increase from 2018. Many of these approaches are summarized in NACTO’s updated Managing Shared Micromobility guidance released in September 2019.
While the specifics vary, cities explored a number of regulatory approaches in 2019, such as RFP processes, limiting the total number of vendors allowed to operate in a city at the same time, limiting the number of vehicles or tying fleet sizes to performance, and offering fleet size bonuses to companies who provide service in low-income neighborhoods or places with limited transportation options. These tools are intended to create clear standards and reward high performing mobility providers.
Parking Schemes in USA:
Throughout 2019, parking for dockless shared micromobility was an ongoing challenge for some cities. Vehicles that are parked or toppled across sidewalks pose safety hazards for the general public, and create barriers to movement for people with disabilities. In Santa Monica, CA, and Alexandria, VA, for example, 42% and 75% of program complaints/citations were for improperly parked vehicles blocking sidewalks.
In 2019, cities attempted a variety of methods to ensure clear access. San Francisco, CA, for example, adopted a requirement that all scooters have the ability to be locked to existing street furniture, which led to an 83% drop in complaints of blocked sidewalks and citations for improper parking. A number of cities, such as Sacramento, CA and Seattle, WA have expanded their provision of bike racks, including on-street corrals, to provide more and better parking locations for shared micromobility vehicles.
Road conditions and the comfort or lack of comfort when sharing space with a car can affect where and whether people use shared micromobility. In Alexandria, Virginia, 53% of the scooter riders surveyed said they like to ride their bikes on trails, sidewalks and roads. There was a bicycle-only road. An early study of Citi Bike Riders in New York, NY found that people who use Citi Bikes are very likely to use a bike path that is protected by the vehicle. According to NACTO research, micromobility systems can be combined with a robust network of interconnected bicycle lanes to make bikes, pedestrians, scooter riders and scooters roads safer.
2019 was a particularly deadly year for pedestrians, cyclists and shared micromobility riders, killing at least 18 people on shared scooters and 2 on shared bicycles. To address these issues, cities in the United States are expanding their cycle path networks. For example, Atlanta, Georgia has promised to triple the protected bike path network over the next two years, prioritizing where bikes and scooters can move. Other cities use scooter royalties to pay for major road improvements. In 2019, Santa Monica, CA upgraded an existing 19-mile bike lane using public road tolls paid by the operator. Who will ride Demographic data is not commonly or uniformly collected by shared micromobility operators. To answer the question of who drives, many cities are conducting opt-in user surveys to better understand which communities are being serviced by micromobility systems. Opt-in surveys provide useful information, but their accuracy is limited by survey distribution, answering questions, access to technology, and other factors.
Age and gender identity:
According to an opt-in user survey conducted in Santa Monica, CA, San Francisco, CA, Minneapolis, Minnesota, Baltimore, Maryland, and Austin, Texas, the overall user base of scooters tends to be younger and more male than the general population. You can see that it is strong. In all surveys, the majority (66-81%) of the users surveyed were male with gender identity, and more than half (50-73%) were under the age of 40.
Income distribution varies from city to city. For example, in Santa Monica, California and Minneapolis, Minnesota, the average scooter user's income looks similar to the median income of the region. About half of scooter users say they earn more than $ 75,000 and the median land income for these cities is $ 75,000 and $ 77,000, respectively. In contrast, San Antonio, Texas has an average income of $ 55,000, but about half of scooter users report that they earn more than $ 75,000.
Opt-in survey data also suggest that racial and ethnic demographics of shared micromobility users vary from city to city, even in cities with similar demographics. For example, both People of Color (POC) Baltimore and Maryland (63% and 72%, respectively) in Washington, D.C. make up the majority of the population. Respondents from the Latin America / x survey in both cities say that the proportion of scooters is higher than the proportion of the population (DC: 1.5x, Baltimore 13.6x). The use of scooters in the black population of Baltimore is proportionally disproportionately higher for white residents, but the use of scooters in DC areas is less common for black residents. , Consistent with the population ratio of white residents.
Cities remove barriers to entry:
In the United States, cities are looking for ways to break down barriers to use by creating programs for low-income, colored communities. These programs typically increase the use of bike sharing in undervalued communities through a combination of discounts, targeted outreach, neighborhood-focused rebalancing and operational planning.
Chicago's Divvy for Everyone (D4E) program successfully combines targeted engagement with discounted prices to attract new and diverse passengers. Available to Chicago and Evanston residents, D4E offers a $ 5 annual membership and the option to pay in cash. The annual Divvy members who participated in the system through the city's D4E program are far more racially diverse than the annual members as a whole. In a 2018 poll, the city of Chicago found that 28% of D4E users were African-American / black, 27% were Asian, and 28% were white. In contrast, in the 2015 Annual Membership Survey, 79% of Divvy's annual cardholders were white.
In Cincinnati, Ohio, the city's Red Bike Program focuses on customer service and education specially tailored to meet the needs of people who are currently underserved or have limited transportation. I am. In 2019, discounted Go program members accounted for 28% of all travel. Other cities are also focusing on operating and redirecting dockless vehicles to ensure equitable access to low-income areas. In San Francisco, California, there are specific requirements for readjusting scooters to give people in low-income areas access to shared micromobility. To date, 52% of scooter rides in San Francisco have started or ended at the "Communities of Concern."
Urban cohorts are also beginning to look for ways to extend shared micromobility services to less mobile people. By the end of 2019, three bicycle sharing systems provided an adaptive vehicle program. For example, in Detroit, Michigan, the Adaptive MoGo program, in its second year, has partnered with local bike rental company Wheelhouse Detroit to open 13 bikes to the public by appointment. Oakland, California piloted the Adaptive BayWheels Bike Share program in the summer of 2019. In Seattle, the city subsidizes local nonprofits and uses revenue from shared micromobility permits to provide adaptive cycling services.
Future outlook for USA Bike Sharing Market:
By the end of 2024, the future of shared micromobility seemed promising with record momentum and rapid growth. Cities have sought to improve the management of shared micromobility, including experimenting with various regulatory structures such as licenses, permits, bids, and formal contracts. As new scooter companies continue to emerge over the years, a small number of large companies (Bird, Lime, Spin, Lyft, and Uber) dominate the majority of the market, the market is stable, and companies are differentiating. It suggests that we can focus more. Through product quality and operation, rather than focusing on gaining market share quickly. The share of bicycles at train stations is also more complex, but the landscape is strong, with passenger numbers skyrocketing in some large cities but declining in many small markets.
Since 2019, the situation of shared micromobility has changed dramatically and unexpectedly. As a result of the ever-changing pandemic of COVID 19, the total number of trips to the United States has plummeted. In the last week of March and the first few weeks of April, total household travel in the United States fell by up to 6,872%, and passengers in transit across the country fell by more than 80% year-on-year. The number of trips using the largest eight bike rental systems at stations fell by an average of 44% in March / May, less than the decline in total trips in these cities. The number of passengers associated with
COVID19 is affecting the economic stability of shared micromobility. In many cities where shared micromobility services are provided by license (e.g.) For example, in mid-March, Lime recorded a 69 ° global sales increase within three days, significantly declining market valuations for many companies. Two of the largest joint micromobility companies announced a significant and immediate layoff in March 2020. For systems that rely on spring renewals for the majority of their sales, the overall reduction in travel can have significant economic implications.
In many cities, shared micromobility has evolved into a useful element of emergency assistance. Shared micro-mobility systems, especially those operating under contracts with cities, are expanding their key operations to support the city's COVID 19 response. These systems, such as Citi Bike in New York, MoGo in Detroit, Austin BCycle, BayWheels in San Francisco Bay, and Bluebikes in the Boston metropolitan area, offer free or discounted membership to healthcare professionals, new stations or valet parking near hospitals, and more. And provide improvements. Cleaning process. In New York, for example, the busiest city bike station in the system in the first week of April is the station next to three major hospitals, and the total number of passengers in the system was New in the first half of March year-on-year. Increased by 67%. Yorker tried to board a subway train or bus to avoid congestion. In Philadelphia, Pennsylvania, Indego Bikeshare offers all Philadelphia residents a $ 5 / month pass to offset the reduction in transportation services.
The purpose of this research is to provide stakeholders in the industry with a thorough insight into the United States Bike Sharing market. The study includes an analysis of difficult data in simple language, as well as the industry's historical and current state, as well as anticipated market size and trends. The market report examines all segments of the industry, with a focus on significant players such as market leaders, followers, and new entrants.
The report includes a PORTER, PESTEL analysis as well as the possible influence of microeconomic market determinants. External and internal elements that are expected to have a favorable or negative impact on the firm have been examined, providing decision-makers with a clear future vision of the industry. The research also aids in comprehending the United States Bike Sharing market dynamics and structure by studying market segments and forecasting market size. The research is an investor's guide since it depicts the competitive analysis of major competitors in the Bike Sharing market by product, price, financial situation, product portfolio, growth plans, and geographical presence.
Major breakthroughs in the United States Bike Sharing industry are discussed, as well as organic and inorganic growth plans. Various companies are focusing on organic growth strategies such as new product releases, product approvals, and other items such as patents and events. Inorganic growth strategies used in the industry included acquisitions, partnerships, and collaborations.
United States Bike Sharing Market Scope:
|
United States Bike Sharing Market |
|
|
Market Size in 2024 |
USD 1048.24 Mn. |
|
Market Size in 2032 |
USD 1521.80 Mn. |
|
CAGR (2025-2032) |
4.77 % |
|
Historic Data |
2019-2024 |
|
Base Year |
2024 |
|
Forecast Period |
2025-2032 |
|
Segment Scope |
by BikeType
|
|
by Model
|
|
|
by Sharing System
|
|
United States Bike Sharing Market Players
- Citi Bike NYC
- Divvy
- Capital Bikeshare
- Hubway
- Biki
- MoGo
- Blue Bikes
- HolySpokes
Frequently Asked Questions
New York region have the highest growth rate of 8.35% in the United States Bike Sharing market with total system installations of 70.
Citi Bike NYC, Divvy, Capital Bikeshare, Hubway, Biki, MoGo, Blue Bikes, HolySpokes are the top players in the United States Bike Sharing market.
NYC, San Francisco, Washington DC, Philadelphia and Chicago are the top 5 regions in the US bike sharing market in terms of system installations.
1. United States Bike Sharing Market: Research Methodology
1.1. Research Data
1.1.1. Secondary Data
1.1.2. Primary Data
1.2. Market Size Estimation
1.2.1. Bottom-Up Approach
1.2.2. Top-Up Approach
1.3. Market Breakdown and Data Triangulation
1.4. Research Assumption
2. United States Bike Sharing Market Introduction
2.1. Study Assumption and Market Definition
2.2. Scope of the Study
2.3. Executive Summary
3. United States Bike Sharing Market: Competitive Landscape
3.1. SMR Competition Matrix
3.2. Key Players Benchmarking
3.2.1. Company Name
3.2.2. Product Segment
3.2.3. End-user Segment
3.2.4. Revenue (2024)
3.2.5. Company Locations
3.3. Market Structure
3.3.1. Market Leaders
3.3.2. Market Followers
3.3.3. Emerging Players
3.4. Mergers and Acquisitions Details
4. United States Bike Sharing Market: Dynamics
4.1. United States Bike Sharing Market Trends
4.2. United States Bike Sharing Market Dynamics
4.2.1. Drivers
4.2.2. Restraints
4.2.3. Opportunities
4.2.4. Challenges
4.3. PORTER’s Five Forces Analysis
4.4. PESTLE Analysis
4.5. Technological Roadmap
4.6. Regulatory Landscape
5. United States Bike Sharing Market: Market Size and Forecast by Segmentation (by Value in USD Million) (2024-2032)
5.1. United States Bike Sharing Market Size and Forecast, by Bike Type (2024-2032)
5.1.1. E-bikes
5.1.2. Conventional bikes
5.2. United States Bike Sharing Market Size and Forecast, by Model (2024-2032)
5.2.1. Free-floating
5.2.2. P2P
5.2.3. Station Based
5.3. United States Bike Sharing Market Size and Forecast, by Sharing System (2024-2032)
5.3.1. Dockless
5.3.2. Docked
5.3.3. Hybrid
6. Company Profile: Key Players
6.1. Citi Bike NYC
6.1.1. Company Overview
6.1.2. Business Portfolio
6.1.3. Financial Overview
6.1.4. SWOT Analysis
6.1.5. Strategic Analysis
6.1.6. Recent Developments
6.2. Divvy
6.3. Capital Bikeshare
6.4. Hubway
6.5. Biki
6.6. MoGo
6.7. Blue Bikes
6.8. HolySpokes
7. Key Findings
8. Industry Recommendations