Tablet Coatings Market Global Industry Analysis and Forecast (2026-2032), Technology Trends
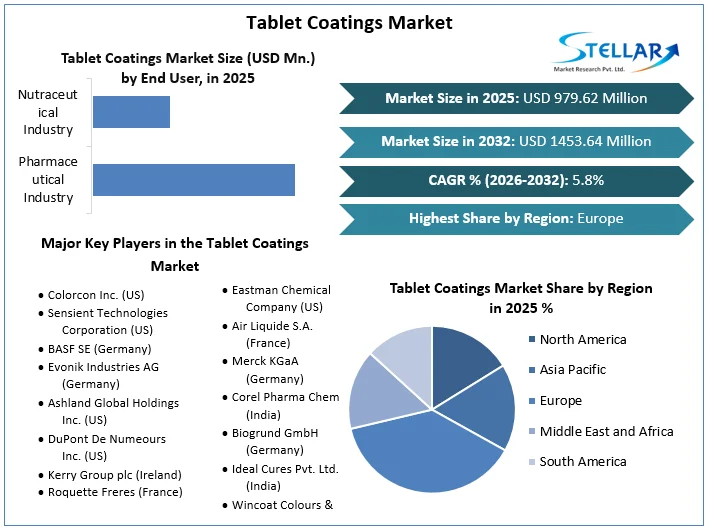
Tablet Coatings Market size was valued at US$ 979.62 Mn. in 2025 and the total revenue is expected to grow at a CAGR of 5.8% through 2026 to 2032, reaching nearly US$ 1453.64 Mn.
Tablet Coatings Market Overview:
The application of a thin polymer-based layer on a tablet or granule containing active medicinal substances is known as tablet coating. Coating solid dosage forms serves a variety of purposes, the most essential of which is to manage release profiles. Tablets are typically coated in horizontal rotating pans, with the coating solution sprayed directly onto the tablet bed's free surface. Sugar coating, film coating, and enteric coating are examples of tablet coating processes.
Though tablet coatings market forecast through 2032 is based on real output, demand and supply of 2025, 2025 numbers are also estimated on real numbers published by key players as well all-important players across the world. Market forecasting till 2032 is done based on past data from 2020 to 2025 with the impact of global lock down on the market in 2020 and 2021.
To get more Insights: Request Free Sample Report
Tablet Coatings Market Dynamics:
The increasing pharmaceutical sector, as well as increased R&D activity in this space, are driving tablet coatings market growth. The tablet coatings market is also being supported by the growing generics market, the quickly growing biopharmaceuticals sector, the growing nutraceutical industry, and the rising adoption of orphan medications. Besides, the burgeoning biologics and biosimilars industry, as well as the shifting focus of pharmaceutical manufacture to emerging markets and the increasing outsourcing of operations to these nations, present considerable prospects for market growth. The growing emphasis on sports nutrition, as well as technology improvements in niche markets, provide considerable growth prospects for businesses in this industry.
During the forecast period, increasing regulatory stringency regarding drug and excipient approval, as well as the costly and time-consuming drug development process; the high cost associated with the microencapsulation process; and unfavorable drug price control policies are expected to restrain the growth of tablet coatings market. Besides, rising safety and quality issues, rising counterfeit medicine penetration, shifting trade rules across nations, and alcohol dose-dumping of sustained-release dosages all represent substantial barriers to the market's growth.
Due to the entry of active mainstream consumers seeking healthy living and fitness, sports nutrition is currently one of the fastest-growing and largest supplement markets. One of the earliest adopters of dietary supplements was the sports nutrition industry. While sports powders, beverages, and bars are the most popular protein delivery forms, there is still demand for a wide range of supplements in other delivery forms. Acid-sensitive components such as creatine (for energy), enzymes (for digestion and inflammation), amino acids (for endurance and muscle recovery), and probiotics are suited for HPMC capsules with specific acid-resistant qualities (for digestive health). Lipid multi-particulates (LMP) technology allows for customized release and flavour masking. These types of formulations can help with a variety of issues related to exercise recovery and overall health. As a result, the growing emphasis on sports nutrition is expected to boost the oral formulations market in the forecast period, which is expected to drives the tablet coatings market growth during the forecast period.
Tablet Coatings Market Segment Analysis:
Based on the Polymer Type, the market is segmented into Cellulosic Polymers, Vinyl Derivatives, Acrylic Polymers, and Other Polymers. Cellulosic Polymers segment is expected to grow rapidly at a CAGR of xx% during the forecast period 2026-2032. The high acceptance of cellulosic polymers can be due to their ability to create coatings with generally acceptable qualities such strong film strength, aqueous solubility, and compressibility, decreased sensitivity to wet granulation, flowability, and better tableting at a reasonable price. The popularity of these polymers for coating applications is further influenced by factors such as global regulatory acceptability and ready availability from a variety of vendors. These are the factors that are expected to drives the growth of the Cellulosic Polymers segment in the Tablet Coatings market during the forecast period 2026-2032.

Based on the End User, the market is segmented into Pharmaceutical Industry, and Nutraceutical Industry. Pharmaceutical Industry segment is expected to hold the largest market share of xx% by 2032. The growing number of medications marketed as tablet formulations, as well as the rising prevalence of disorders for which tablet-based formulations are the principal treatment, are driving demand for tablet coatings in the pharmaceutical business. The pharmaceutical industry's tablet coatings market is also growing due to rising need for new drug delivery formulations.
Tablet Coatings Market Regional Insights:
Europe region is expected to dominate the Tablet Coatings market during the forecast period 2026-2032. Europe region is expected to hold the largest market share of xx% by 2027. The presence of a number of pharmaceutical companies with massive production capacity, resulting in significant excipient consumption, accounts for a highest share of this market segment. The increasing focus on superior pharmaceutical products, generics, and biosimilars has increased demand for new excipients, which is expected to boost market growth in the Europe region during the forecast period.
Asia Pacific region is expected to grow rapidly in the tablet coatings market at a CAGR of xx% through out the forecast period 2026-2032. This is due to the various types of coating demand such as organic coating, inorganic coating, and many others in Asia Pacific region. These different types of coating demand for different coating processer systems, due to factors such as rapid economic development, globalization, and increasing demand of tablet coating systems in the pharmaceutical sector in the Asia Pacific region.
Recent Trends in Tablet Coatings Market:
Electrostatic Dry Coating Technology: For the first time, electrostatic dry powder coating in a pan coater system was used to develop an electrostatic dry powder coating procedure for tablets. The enhanced dry powder coating technique results in tablets with a smooth surface, good coating consistency, and a release profile similar to the tablet cores. This unique electrostatic dry powder coating approach for pharmaceutical items provides an alternative to aqueous or solvent-based coating processes.
Food technology, paint technology, metal coatings, coating of living cells, and coating of tablets and capsules all benefit from the electrostatic coating process. The electrostatic powder coating principle states that a mixture of finely ground particles and polymers is sprayed onto a substrate surface without the need of any solvent, and then the substrate is heated for curing in an oven until the powder mixture is fused into film.
Supercell Coating Technology: Friable tablets, as well as flat or very oblong tablet shapes, are coated with Supercell Coating Technology. The drying time is really quick in this procedure, thus it is very convenient. Tablets that are particularly hygroscopic can be coated. The Deposition precision is great enough that Active Tablets can have pharmaceutical ingredients stacked on top of them. Several layers of consistent flavour masking or modified release Coatings can be applied one after the other in a single application.
The objective of the report is to present a comprehensive analysis of the Tablet Coatings Market to the stakeholders in the industry. The report provides trends that are most dominant in the Tablet Coatings Market and how these trends will influence new business investments and market development throughout the forecast period. The report also aids in the comprehension of the market dynamics and competitive structure of the market by analyzing market leaders, market followers, and regional players.
The qualitative and quantitative data provided in the Tablet Coatings Market report is to help understand which market segments, regions are expected to grow at higher rates, factors affecting the market, and key opportunity areas, which will drive the industry and market growth through the forecast period. The report also includes the competitive landscape of key players in the industry along with their recent developments in the Tablet Coatings Market. The report studies factors such as company size, market share, market growth, revenue, production volume, and profits of the key players in the global market.
The report provides Porter's Five Force Model, which helps in designing the business strategies in the market. The report helps in identifying how many rivals are existing, who they are, and how their product quality is in the Market. The report also analyses if the Tablet Coatings Market is easy for a new player to gain a foothold in the market, do they enter or exit the market regularly if the market is dominated by a few players, etc.
The report also includes a PESTEL Analysis, which aids in the development of company strategies. Political variables help in figuring out how much a government can influence the Market. Economic variables aid in the analysis of economic performance drivers that have an impact on the Market. Understanding the impact of the surrounding environment and the influence of environmental concerns on the Tablet Coatings Market is aided by legal factors.
Tablet Coatings Market Scope:
|
Tablet Coatings Market |
|
|
Market Size in 2025 |
USD 979.62 Mn. |
|
Market Size in 2032 |
USD 1453.64 Mn. |
|
CAGR (2026-2032) |
5.8% |
|
Historic Data |
2020-2025 |
|
Base Year |
2025 |
|
Forecast Period |
2026-2032 |
|
Segment Scope |
By Polymer Type
|
|
By Functionality
|
|
|
By Type
|
|
|
By End User
|
|
|
Regional Scope |
North America- United States, Canada, and Mexico Europe – UK, France, Germany, Italy, Spain, Sweden, Austria, and Rest of Europe Asia Pacific – China, India, Japan, South Korea, Australia, ASEAN, Rest of APAC Middle East and Africa - South Africa, GCC, Egypt, Nigeria, Rest of the Middle East and Africa South America – Brazil, Argentina, Rest of South America |
Tablet Coatings Market Key Players
- Colorcon Inc. (US)
- Sensient Technologies Corporation (US)
- BASF SE (Germany)
- Evonik Industries AG (Germany)
- Ashland Global Holdings Inc. (US)
- DuPont De Numeours Inc. (US)
- Kerry Group plc (Ireland)
- Roquette Freres (France)
- Eastman Chemical Company (US)
- Air Liquide S.A. (France)
- Merck KGaA (Germany)
- Corel Pharma Chem (India)
- Biogrund GmbH (Germany)
- Ideal Cures Pvt. Ltd. (India)
- Wincoat Colours & Coatings Pvt. Ltd. (India)
Frequently Asked Questions
Europe is expected to hold the highest share in the Tablet Coatings Market.
Colorcon Inc. (US), Sensient Technologies Corporation (US), BASF SE (Germany), Evonik Industries AG (Germany), and Ashland Global Holdings Inc. (US) are the top key players in the Tablet Coatings Market.
Pharmaceutical Industry segment hold the largest market share in the Tablet Coatings market by 2032.
The market size of the Tablet Coatings market is expected to reach USD 1453.64 Mn. by 2032.
The market size of the Tablet Coatings market was worth US $ 979.62 Mn. in 2025.
1. Tablet Coatings Market: Research Methodology
1.1. Research Data
1.1.1. Primary Data
1.1.2. Secondary Data
1.2. Market Size Estimation
1.2.1. Bottom-Up Approach
1.2.2. Top-Down Approach
1.3. Market Breakdown and Data Triangulation
1.4. Research Assumptions
2. Tablet Coatings Market: Executive Summary
2.1. Market Overview
2.2. Market Size (2025) and Forecast (2026– 2032) and Y-O-Y%
2.3. Market Size (USD) and Market Share (%) – By Segments and Regions
3. Tablet Coatings Market: Competitive Landscape
3.1. Stellar Competition Matrix
3.2. Key Players Benchmarking
3.2.1. Company Name
3.2.2. Headquarter
3.2.3. Product Segment
3.2.4. End-user Segment
3.2.5. Y-O-Y%
3.2.6. Revenue (2025)
3.2.7. Profit Margin
3.2.8. Market Share
3.2.9. Company Locations
3.3. Market Structure
3.3.1. Market Leaders
3.3.2. Market Followers
3.3.3. Emerging Players
3.4. Consolidation of the Market
3.4.1. Strategic Initiatives and Developments
3.4.2. Mergers and Acquisitions
3.4.3. Collaborations and Partnerships
3.4.4. Product Launches and Innovations
4. Tablet Coatings Market: Dynamics
4.1. Market Trends by Region
4.1.1. North America
4.1.2. Europe
4.1.3. Asia Pacific
4.1.4. Middle East and Africa
4.1.5. South America
4.2. Market Drivers
4.3. Market Restraints
4.4. Market Opportunities
4.5. Market Challenges
4.6. PORTER’s Five Forces Analysis
4.6.1. Intensity of the Rivalry
4.6.2. Threat of New Entrants
4.6.3. Bargaining Power of Suppliers
4.6.4. Bargaining Power of Buyers
4.6.5. Threat of Substitutes
4.7. PESTLE Analysis
4.7.1. Political Factors
4.7.2. Economic Factors
4.7.3. Social Factors
4.7.4. Technological Factors
4.7.5. Legal Factors
4.7.6. Environmental Factors
4.8. Technological Roadmap
4.9. Regulatory Landscape
4.9.1. Market Regulation by Region
4.9.1.1. North America
4.9.1.2. Europe
4.9.1.3. Asia Pacific
4.9.1.4. Middle East and Africa
4.9.1.5. South America
4.9.2. Impact of Regulations on Market Dynamics
4.9.3. Government Schemes and Initiatives
5. Tablet Coatings Market Size and Forecast by Segments (by Value USD Million)
5.1. Tablet Coatings Market Size and Forecast, By Polymer Type (2025-2032)
5.1.1. Cellulosic Polymers
5.1.2. Vinyl Derivatives
5.1.3. Acrylic Polymers
5.1.4. Other Polymers
5.2. Tablet Coatings Market Size and Forecast, By Functionality (2025-2032)
5.2.1. Non-functional non-modifying coatings
5.2.2. Functional modifying coatings
5.2.3. Functional non-modifying coatings
5.3. Tablet Coatings Market Size and Forecast, By Type (2025-2032)
5.3.1. Film-coated tablets
5.3.2. Sugar-coated tablets
5.3.3. Enteric-coated tablets
5.3.4. Gelatin-coated tablets
5.3.5. Other tablet coatings
5.4. Tablet Coatings Market Size and Forecast, By End User (2025-2032)
5.4.1. Pharmaceutical Industry
5.4.2. Nutraceutical Industry
5.5. Tablet Coatings Market Size and Forecast, by Region (2025-2032)
5.5.1. North America
5.5.2. Europe
5.5.3. Asia Pacific
5.5.4. Middle East and Africa
5.5.5. South America
6. North America Tablet Coatings Market Size and Forecast (by Value USD Million)
6.1. North America Tablet Coatings Market Size and Forecast, By Polymer Type (2025-2032)
6.1.1. Cellulosic Polymers
6.1.2. Vinyl Derivatives
6.1.3. Acrylic Polymers
6.1.4. Other Polymers
6.2. North America Tablet Coatings Market Size and Forecast, By Functionality (2025-2032)
6.2.1. Non-functional non-modifying coatings
6.2.2. Functional modifying coatings
6.2.3. Functional non-modifying coatings
6.3. North America Tablet Coatings Market Size and Forecast, By Type (2025-2032)
6.3.1. Film-coated tablets
6.3.2. Sugar-coated tablets
6.3.3. Enteric-coated tablets
6.3.4. Gelatin-coated tablets
6.3.5. Other tablet coatings
6.4. North America Tablet Coatings Market Size and Forecast, By End User (2025-2032)
6.4.1. Pharmaceutical Industry
6.4.2. Nutraceutical Industry
6.5. North America Tablet Coatings Market Size and Forecast, by Country (2025-2032)
6.5.1. United States
6.5.2. Canada
6.5.3. Mexico
7. Europe Tablet Coatings Market Size and Forecast (by Value USD Million)
7.1. Europe Tablet Coatings Market Size and Forecast, By Polymer Type (2025-2032)
7.2. Europe Tablet Coatings Market Size and Forecast, By Functionality (2025-2032)
7.3. Europe Tablet Coatings Market Size and Forecast, By Type (2025-2032)
7.4. Europe Tablet Coatings Market Size and Forecast, By End User (2025-2032)
7.5. Europe Tablet Coatings Market Size and Forecast, by Country (2025-2032)
7.5.1. UK
7.5.2. France
7.5.3. Germany
7.5.4. Italy
7.5.5. Spain
7.5.6. Sweden
7.5.7. Austria
7.5.8. Rest of Europe
8. Asia Pacific Tablet Coatings Market Size and Forecast (by Value USD Million)
8.1. Asia Pacific Tablet Coatings Market Size and Forecast, By Polymer Type (2025-2032)
8.2. Asia Pacific Tablet Coatings Market Size and Forecast, By Functionality (2025-2032)
8.3. Asia Pacific Tablet Coatings Market Size and Forecast, By Type (2025-2032)
8.4. Asia Pacific Tablet Coatings Market Size and Forecast, By End User (2025-2032)
8.5. Asia Pacific Tablet Coatings Market Size and Forecast, by Country (2025-2032)
8.5.1. China
8.5.2. S Korea
8.5.3. Japan
8.5.4. India
8.5.5. Australia
8.5.6. Indonesia
8.5.7. Malaysia
8.5.8. Vietnam
8.5.9. Taiwan
8.5.10. Bangladesh
8.5.11. Pakistan
8.5.12. Rest of Asia Pacific
9. Middle East and Africa Tablet Coatings Market Size and Forecast (by Value USD Million)
9.1. Middle East and Africa Tablet Coatings Market Size and Forecast, By Polymer Type (2025-2032)
9.2. Middle East and Africa Tablet Coatings Market Size and Forecast, By Functionality (2025-2032)
9.3. Middle East and Africa Tablet Coatings Market Size and Forecast, By Type (2025-2032)
9.4. Middle East and Africa Tablet Coatings Market Size and Forecast, By End User (2025-2032)
9.5. Middle East and Africa Tablet Coatings Market Size and Forecast, by Country (2025-2032)
9.5.1. South Africa
9.5.2. GCC
9.5.3. Egypt
9.5.4. Nigeria
9.5.5. Rest of ME&A
10. South America Tablet Coatings Market Size and Forecast (by Value USD Million)
10.1. South America Tablet Coatings Market Size and Forecast, By Polymer Type (2025-2032)
10.2. South America Tablet Coatings Market Size and Forecast, By Functionality (2025-2032)
10.3. South America Tablet Coatings Market Size and Forecast, By Type (2025-2032)
10.4. South America Tablet Coatings Market Size and Forecast, By End User (2025-2032)
10.5. South America Tablet Coatings Market Size and Forecast, by Country (2025-2032)
10.5.1. Brazil
10.5.2. Argentina
10.5.3. Rest of South America
11. Company Profile: Key players
11.1. Colorcon Inc. (US)
11.1.1. Overview
11.1.2. Business Portfolio
11.1.3. Financial Overview
11.1.3.1. Total Revenue
11.1.3.2. Segment Revenue
11.1.3.3. Regional Revenue
11.1.4. SWOT Analysis
11.1.5. Strategic Analysis
11.1.6. Recent Developments
11.2. Sensient Technologies Corporation (US)
11.3. BASF SE (Germany)
11.4. Evonik Industries AG (Germany)
11.5. Ashland Global Holdings Inc. (US)
11.6. DuPont De Numeours Inc. (US)
11.7. Kerry Group plc (Ireland)
11.8. Roquette Freres (France)
11.9. Eastman Chemical Company (US)
11.10. Air Liquide S.A. (France
11.11. Merck KGaA (Germany)
11.12. Corel Pharma Chem (India)
11.13. Biogrund GmbH (Germany)
11.14. Ideal Cures Pvt. Ltd. (India)
11.15. Wincoat Colours & Coatings Pvt. Ltd. (India)
12. Key Findings
13. Industry Recommendations
13.1. Strategic Recommendations
13.2. Future Outlook