SATCOM on the Move Market Global Industry Analysis and Forecast (2026-2032) Size, Share, Growth, Trend
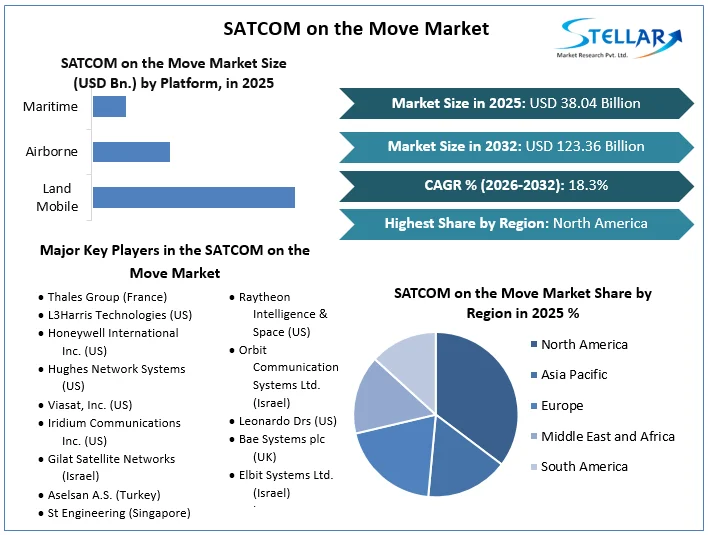
The SATCOM on the Move Market size was valued at US$ 38.04 Bn. in 2025. The global SATCOM on the Move Market is estimated to grow at a CAGR of 18.3% over the forecast period.
SATCOM on the Move Market Overview:
The utilization of a network of geostationary satellites for radio communications relay between a transmitter and receiver located at two distinct points on the globe is known as SATCOM. In commercial multi-media requirements as well as military intelligence, surveillance, and reconnaissance communication requirements, there is an increasing desire for communication everywhere, at any time. Satellite Connections (SATCOM), and notably SATCOM on-the-move (SOTM) products and services, have seen substantial growth as a result of the necessity to maintain consistent mobile communications regardless of location across the globe. Maintaining a line-of-sight (LOS) connection with the target satellite is a major challenge for any SATCOM system.
To get more Insights: Request Free Sample Report
SATCOM on the Move Market Dynamics:
Growing Use of Electronically Steered Phased Antennas:
Increased demand for communication on-the-move (OTM) solutions has resulted in the increased use of electronically guided phased antennas for platforms such as commercial vehicles, military vehicles, trains, and boats (ESPA). These antennas can track and sustain satellite links even while platforms such as military vehicles, railroads, or boats are moving. Hybrid beam steering is employed in this phased array for OTM, both electrically for elevation and mechanically for azimuth. Because the steering of an antenna terminal is so important in gaining a satellite link, ESPA is utilized to prevent mechanical motion.
The Air Force Space and Missile Systems Center (SMC), in collaboration with the Pentagon's Defense Innovation Unit, granted Atlas Space Operations a contract in April 2019 to prototype an electronically steered antenna array to serve multi-band, multi-mission Air Force needs.
L3Harris Technologies completed the creation of an electronic phased array ground antenna for the United States Space Force in January 2021. ESPA prototypes have also been developed by Lockheed Martin and Atlas Space Operations. L3Harris' antenna, along with those from Lockheed Martin and Atlas Space, was connected with the Space Force's Satellite Control Network to show numerous simultaneous satellite interactions. The SCN is a decrepit network of parabolic dish antennas that were once used to launch military satellites.
Growing Adoption of Portable SATCOM terminals:
A portable SATCOM terminal is referred to as a satellite communicator or hotspot, which is one of the smallest two-way satellite communication systems. A GPS chip embedded within the smartphone collects location data. When the SEND is turned on, this data is transferred to a commercial monitoring agency, which then passes it on to the appropriate response agency via commercial satellites. Hikers, mountain bikers, climbers, sailors, and pilots are common users and buyers of these devices. It's also useful for people who work in remote regions (loggers, foresters, geologists, fisheries, and wildlife staff). Other alternatives include sending pre-programmed messages and utilizing Google Earth to follow breadcrumbs. Germin InReach mini, Spot X, Zoleo satellite communicator, and Bivy stick blue are some of the latest gadgets that allow 2-way satellite communication.
Iridium's Global Maritime Distress and Safety System (GMDSS) service will be available in 2020. Iridium now has access to a fleet of vessels that are required by maritime law to maintain this L-band safety service, thanks to the launch of new GMDSS terminals. GMDSS is a sophisticated safety network that facilitates rescue and disseminates weather and navigation information by providing communication and coordination between people, vessels, and even aircraft.
High Costs of Development and Maintenance of Infrastructure to Support SATCOM Antennas:
One of the biggest issues hampering the market's growth is the high cost of developing and maintaining earth station infrastructure. The majority of the essential components are custom-fabricated or obtained from commercial off-the-shelf manufacturers, both of which are costly. In addition, the design, development, and construction of antennas and their components necessitate a significant amount of time and effort on the part of trained experts. The required level of ability is a considerable barrier to access. The value chains of these systems also demand significant investments in R&D, production, system integration, and assembly.
SATCOM services are utilized to support extremely advanced defense systems, making any system breakdown negative. They must be sturdy, energy-efficient, and have a large detecting range in addition to being very accurate and reliable. As a result, players in this industry must construct highly functioning and efficient ground facilities in order to maintain market leadership and remain competitive. This translates to major testing and infrastructure investments, as well as relationships with universities, research institutes, and other businesses.
SATCOM on the Move Market Segment Analysis:
By Platform, the SATCOM on the Move Market is segmented into Land Mobile, Airborne, and Maritime. The Airborne segment dominated the market with a 46% share in 2025. The segment growth is attributed to the growing demand for high-definition intelligence, surveillance, and reconnaissance (ISR) videos, as well as the growing number of connected commercial aircraft, rising adoption of UAVs, and growing number of private aviation companies across the globe. The French Air Force improved their airborne satellite communication capability in December 2019 by implementing new Thales technologies. Thales was awarded a contract by the French Defense Agency to design and build the next-generation Syracuse 4 satellite communication system. The French military forces will be able to improve the SATCOM system in the Charles De Gaulle Aircraft Carrier and the Rafale combat aircraft thanks to this contract.

By Vertical, the SATCOM on the Move Market is segmented into Commercial and Government & Military. The Commercial Segment is expected to grow at a significant rate at a CAGR of 16.1% during the forecast period. The growing demand for mobile broadband coverage in remote and far-flung areas, streaming information and entertainment, extensive use of small satellites for commercialization and data transferability, technological advancements in transportation and logistics networks, and rising demand for broadband connections and VSAT connectivity.
SATCOM on the Move Market Regional Insights:
The North American region dominated the market with a 43.1% share in 2025. The United States has a sizable market for SATCOM equipment in the North American region. To improve the quality and effectiveness of satellite communication, the US government is boosting its investments in the field of SATCOM. The increasing investment in SATCOM equipment to enhance the armed forces' defense and surveillance capabilities, the modernization of existing communication in military platforms, and the increasing use of SATCOM equipment by critical infrastructure and law enforcement agencies are all expected to drive the SATCOM on the move in North America.
The objective of the report is to present a comprehensive analysis of the Global SATCOM on the Move Market to the stakeholders in the industry. The report provides trends that are most dominant in the Global SATCOM on the Move Market and how these trends will influence new business investments and market development throughout the forecast period. The report also aids in the comprehension of the Global SATCOM on the Move Market dynamics and competitive structure of the market by analyzing market leaders, market followers, and regional players.
The qualitative and quantitative data provided in the Global SATCOM on the Move Market report is to help understand which market segments, regions are expected to grow at higher rates, factors affecting the market, and key opportunity areas, which will drive the industry and market growth through the forecast period. The report also includes the competitive landscape of key players in the industry along with their recent developments in the Global SATCOM on the Move Market. The report studies factors such as company size, market share, market growth, revenue, production volume, and profits of the key players in the Global SATCOM on the Move Market.
The report provides Porter's Five Force Model, which helps in designing the business strategies in the market. The report helps in identifying how many rivals are existing, who they are, and how their product quality is in the Global SATCOM on the Move Market. The report also analyses if the Global SATCOM on the Move Market is easy for a new player to gain a foothold in the market, do they enter or exit the market regularly if the market is dominated by a few players, etc.
The report also includes a PESTEL Analysis, which aids in the development of company strategies. Political variables help in figuring out how much a government can influence the Global SATCOM on the Move Market. Economic variables aid in the analysis of economic performance drivers that have an impact on the Global SATCOM on the Move Market. Understanding the impact of the surrounding environment and the influence of environmental concerns on the Global SATCOM on the Move Market is aided by legal factors.
SATCOM on the Move Market Scope:
|
SATCOM on the Move Market |
|
|
Market Size in 2025 |
USD 38.04 Bn. |
|
Market Size in 2032 |
USD 123.36 Bn. |
|
CAGR (2026-2032) |
18.3% |
|
Historic Data |
2020-2025 |
|
Base Year |
2025 |
|
Forecast Period |
2026-2032 |
|
Segment Scope |
by Platform
|
|
by Frequency
|
|
|
By Vertical
|
|
|
Regional Scope |
North America- United States, Canada, and Mexico Europe – UK, France, Germany, Italy, Spain, Sweden, Austria, and Rest of Europe Asia Pacific – China, India, Japan, South Korea, Australia, ASEAN, Rest of APAC Middle East and Africa - South Africa, GCC, Egypt, Nigeria, Rest of the Middle East and Africa South America – Brazil, Argentina, Rest of South America |
SATCOM on the Move Market Key Players:
- Thales Group (France)
- L3Harris Technologies (US)
- Honeywell International Inc. (US)
- Hughes Network Systems (US)
- Viasat, Inc. (US)
- Iridium Communications Inc. (US)
- Gilat Satellite Networks (Israel)
- Aselsan A.S. (Turkey)
- St Engineering (Singapore)
- Raytheon Intelligence & Space (US)
- Orbit Communication Systems Ltd. (Israel)
- Leonardo Drs (US)
- Bae Systems plc (UK)
- Elbit Systems Ltd. (Israel)
- Indra Sistemas (Spain)
- Collins Aerospace (US)
- Ball Corporation (US)
- Space Exploration Technologies Corporation (Spacex) (US)
- Mobile Satellite Communications (Most)
- Avanti Communications Group plc (UK)
Frequently Asked Questions
The North American region is expected to hold the highest share in the SATCOM on the Move Market.
The market size of the SATCOM on the Move Market by 2032 is expected to reach at US$ 123.36 Bn.
The forecast period for the SATCOM on the Move Market is 2026-2032
The market size of the SATCOM on the Move Market in 2025 was valued at US$ 38.04 Bn.
1. Research Methodology
1.1 Research Data
1.1.1. Primary Data
1.1.2. Secondary Data
1.2. Market Size Estimation
1.2.1. Bottom-Up Approach
1.2.2. Top-Down Approach
1.3. Market Breakdown and Data Triangulation
1.4. Research Assumption
2. SATCOM on the Move Market Executive Summary
2.1. Market Overview
2.2. Market Size (2025) and Forecast (2026– 2032) and Y-O-Y%
2.3. Market Size (USD) and Market Share (%) – By Segments and Regions
3. Global SATCOM on the Move Market: Competitive Landscape
3.1. SMR Competition Matrix
3.2. Key Players Benchmarking
3.2.1. Company Name
3.2.2. Headquarter
3.2.3. Business Segment
3.2.4. End-user Segment
3.2.5. Y-O-Y%
3.2.6. Revenue (2025)
3.2.7. Profit Margin
3.2.8. Market Share
3.2.9. Company Locations
3.3. Market Structure
3.3.1. Market Leaders
3.3.2. Market Followers
3.3.3. Emerging Players
3.4. Consolidation of the Market
3.4.1. Strategic Initiatives and Developments
3.4.2. Mergers and Acquisitions
3.4.3. Collaborations and Partnerships
3.4.4. Service Launches and Innovations
4. SATCOM on the Move Market: Dynamics
4.1. SATCOM on the Move Market Trends by Region
4.1.1. North America
4.1.2. Europe
4.1.3. Asia Pacific
4.1.4. Middle East and Africa
4.1.5. South America
4.2. SATCOM on the Move Market Drivers
4.3. SATCOM on the Move Market Restraints
4.4. SATCOM on the Move Market Opportunities
4.5. SATCOM on the Move Market Challenges
4.6. PORTER’s Five Forces Analysis
4.6.1. Intensity of the Rivalry
4.6.2. Threat of New Entrants
4.6.3. Bargaining Power of Suppliers
4.6.4. Bargaining Power of Buyers
4.6.5. Threat of Substitutes
4.7. PESTLE Analysis
4.7.1. Political Factors
4.7.2. Economic Factors
4.7.3. Social Factors
4.7.4. Technological Factor
4.7.5. Legal Factors
4.7.6. Environmental Factors
4.8. Technological Roadmap
4.9. Regulatory Landscape
4.9.1. Market Regulation by Region
4.9.1.1. North America
4.9.1.2. Europe
4.9.1.3. Asia Pacific
4.9.1.4. Middle East and Africa
4.9.1.5. South America
4.9.2. Impact of Regulations on Market Dynamics
4.9.3. Government Schemes and Initiatives
5. SATCOM on the Move Market: Global Market Size and Forecast by Segmentation (by Value in USD Million) (2025-2032)
5.1. SATCOM on the Move Market Size and Forecast, by Platform (2025-2032)
5.1.1. Land Mobile
5.1.2. Airborne
5.1.3. Maritime
5.2. SATCOM on the Move Market Size and Forecast, by Frequency (2025-2032)
5.2.1. C Band
5.2.2. L,&S Band
5.2.3. X Band
5.2.4. Ka Band
5.2.5. Ku Band
5.2.6. UHF Band
5.2.7. SHF Band
5.2.8. Others
5.3. SATCOM on the Move Market Size and Forecast, by Vertical (2025-2032)
5.3.1. Commercial
5.3.2. Government & Military
5.4. SATCOM on the Move Market Size and Forecast, by Region (2025-2032)
5.4.1. North America
5.4.2. Europe
5.4.3. Asia Pacific
5.4.4. Middle East and Africa
5.4.5. South America
6. North America SATCOM on the Move Market Size and Forecast by Segmentation (by Value in USD Million) (2025-2032)
6.1. North America SATCOM on the Move Market Size and Forecast, by Platform (2025-2032)
6.1.1. Land Mobile
6.1.2. Airborne
6.1.3. Maritime
6.2. North America SATCOM on the Move Market Size and Forecast, by Frequency (2025-2032)
6.2.1. C Band
6.2.2. L,&S Band
6.2.3. X Band
6.2.4. Ka Band
6.2.5. Ku Band
6.2.6. UHF Band
6.2.7. SHF Band
6.2.8. Others
6.3. North America SATCOM on the Move Market Size and Forecast, by Vertical (2025-2032)
6.3.1. Commercial
6.3.2. Government & Military
6.4. North America SATCOM on the Move Market Size and Forecast, by Country (2025-2032)
6.4.1. United States
6.4.2. Canada
6.4.3. Mexico
7. Europe SATCOM on the Move Market Size and Forecast by Segmentation (by Value in USD Million) (2025-2032)
7.1. Europe SATCOM on the Move Market Size and Forecast, by Platform (2025-2032)
7.2. Europe SATCOM on the Move Market Size and Forecast, by Frequency (2025-2032)
7.3. Europe SATCOM on the Move Market Size and Forecast, by Vertical (2025-2032)
7.4. Europe SATCOM on the Move Market Size and Forecast, by Country (2025-2032)
7.4.1. United Kingdom
7.4.2. France
7.4.3. Germany
7.4.4. Italy
7.4.5. Spain
7.4.6. Sweden
7.4.7. Austria
7.4.8. Rest of Europe
8. Asia Pacific SATCOM on the Move Market Size and Forecast by Segmentation (by Value in USD Million) (2025-2032)
8.1. Asia Pacific SATCOM on the Move Market Size and Forecast, by Platform (2025-2032)
8.2. Asia Pacific SATCOM on the Move Market Size and Forecast, by Frequency (2025-2032)
8.3. Asia Pacific SATCOM on the Move Market Size and Forecast, by Vertical (2025-2032)
8.4. Asia Pacific SATCOM on the Move Market Size and Forecast, by Country (2025-2032)
8.4.1. China
8.4.2. S Korea
8.4.3. Japan
8.4.4. India
8.4.5. Australia
8.4.6. Indonesia
8.4.7. Malaysia
8.4.8. Vietnam
8.4.9. Taiwan
8.4.10. Rest of Asia Pacific
9. Middle East and Africa SATCOM on the Move Market Size and Forecast by Segmentation (by Value in USD Million) (2025-2032)
9.1. Middle East and Africa SATCOM on the Move Market Size and Forecast, by Platform (2025-2032)
9.2. Middle East and Africa SATCOM on the Move Market Size and Forecast, by Frequency (2025-2032)
9.3. Middle East and Africa SATCOM on the Move Market Size and Forecast, by Vertical (2025-2032)
9.4. Middle East and Africa SATCOM on the Move Market Size and Forecast, by Country (2025-2032)
9.4.1. South Africa
9.4.2. GCC
9.4.3. Nigeria
9.4.4. Rest of ME&A
10. South America SATCOM on the Move Market Size and Forecast by Segmentation (by Value in USD Million) (2025-2032)
10.1. South America SATCOM on the Move Market Size and Forecast, by Platform (2025-2032)
10.2. South America SATCOM on the Move Market Size and Forecast, by Frequency (2025-2032)
10.3. South America SATCOM on the Move Market Size and Forecast, by Vertical (2025-2032)
10.4. South America SATCOM on the Move Market Size and Forecast, by Country (2025-2032)
10.4.1. Brazil
10.4.2. Argentina
10.4.3. Rest Of South America
11. Company Profile: Key Players
11.1. Thales Group (France)
11.1.1. Company Overview
11.1.2. Business Portfolio
11.1.3. Financial Overview
11.1.3.1. Total Revenue
11.1.3.2. Segment Revenue
11.1.3.3. Regional Revenue
11.1.4. SWOT Analysis
11.1.5. Strategic Analysis
11.1.6. Recent Developments
11.2. L3Harris Technologies (US)
11.3. Honeywell International Inc. (US)
11.4. Hughes Network Systems (US)
11.5. Viasat, Inc. (US)
11.6. Iridium Communications Inc. (US)
11.7. Gilat Satellite Networks (Israel)
11.8. Aselsan A.S. (Turkey)
11.9. St Engineering (Singapore)
11.10. Raytheon Intelligence & Space (US)
11.11. Orbit Communication Systems Ltd. (Israel)
11.12. Leonardo Drs (US)
11.13. Bae Systems plc (UK)
11.14. Elbit Systems Ltd. (Israel)
11.15. Indra Sistemas (Spain)
11.16. Collins Aerospace (US)
11.17. Ball Corporation (US)
11.18. Space Exploration Technologies Corporation (Spacex) (US)
11.19. Mobile Satellite Communications (Most)
11.20. Avanti Communications Group plc (UK)
12. Key Findings
13. Analyst Recommendations
13.1. Strategic Recommendations
13.2. Future Outlook


