Plant-based Beverages Market: Global Industry Analysis and Forecast (2024-2030) by Product, Source, and Region.
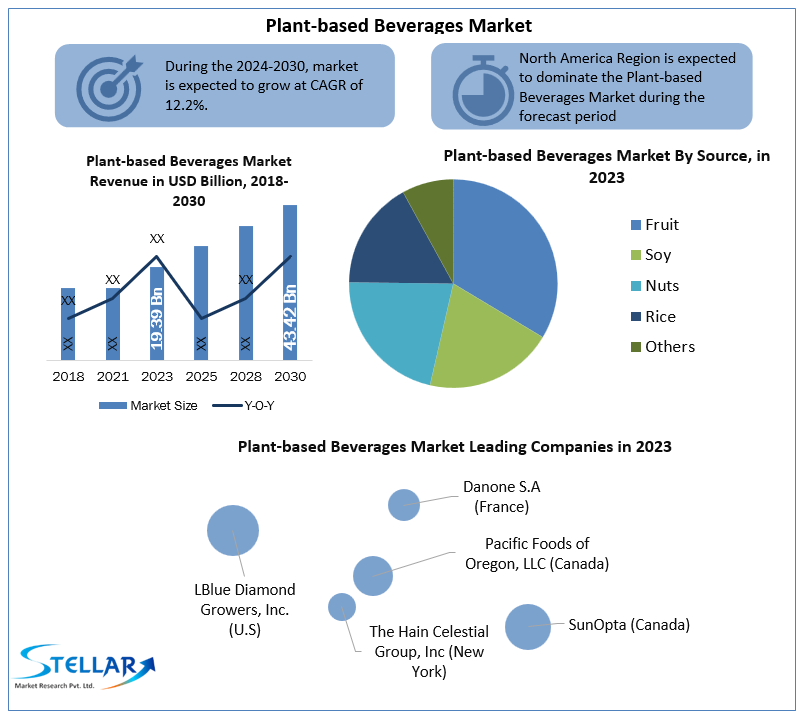
Plant-based beverages Market size was valued at US$ 19.39 Bn. in 2023. The global Plant-based Beverage Market is estimated to grow at a CAGR of 12.2% over the forecast period.
Format : PDF | Report ID : SMR_286
Plant-based Beverages Market Definition:
Plant drinks are drinks that can be replaced by dairy products. These drinks are plant-based and are considered a very healthy alternative to dairy products. Soy milk, rice milk, oat milk, cashew milk, coconut milk, flax milk and almond milk are some of the most popular choices for plant-based beverages around the world. They are measured vigorous, due to the occurrence of several indispensable vitamins and minerals. They are also low in fat, cholesterol, and lactose-free. We have considerd segement analysis in the plant-based beverages market as by product, source and region.
The percentage of the vegan population is increasing rapidly, in which soy milk is the most popular herbal drink because it brings high nutritional value to the human body and is also considered rich in vitamins and minerals. It is widely consumed around the world as it has the same benefits as dairy-made from milk.
To get more Insights: Request Free Sample Report
Plant-based Beverages Market Dynamics:
Increasing consumer preference for healthy and nutritious beverages is driving the growth of the Plant-based beverages market:
In addition to vegans and those who simply want to eat more plant foods, plant-based dairy alternatives are for people who are allergic to dairy products or are sensitive to the lactose found in regular dairy products. The increasing number of cases of lactose intolerance, especially in developed countries such as U.S, and Canada, has increased the opportunities for vegan beverages, which is driving the growth of the plant-based beverages market.
Additionally, various benefits offered by plant-based drinks, such as improved muscle and mental health, may accelerate the growth of the plant-based drinks market. Growing awareness of the health benefits of vegetables, fruits and nuts is accelerating the growth of the plant-based beverages market. Increasing health consciousness amongst consumers owing to the frenetic and inactive lifestyle is considered as the major factor for fuelling the growth of the market.

Fluctuations in raw material and product prices are high are hampering the growth of the market:
The price of plant-based milkshakes can range greatly from $3 or more for half-gallon regular milk is usually much cheaper. A full gallon costs an average of $3.58. Cow's milk will be considered the cheapest in this market. Sales of plant-based milk have increased by 70% in the UK. In addition, retail and wholesale costs will be more expensive. Plant-based milk production is more expensive than cow's milk, partly because the dairy industry is subsidized by the UK government. These major factors are restraining the growth of the plant-based beverages market.
The introduction of new flavors & variety of plant-based beverages is creating a huge opportunity for the market:
Consumers rank taste as the top motivation for eating plant-based goods across all food and beverage categories, followed by health, the environment, animal welfare, and diet considerations. According to the 50% of customers who told Mintel researchers that plant-based foods need a larger diversity of flavours, there is space for development in taste. Soy milk, coconut milk, almond milk, cashew milk, flax milk, rice milk, and oat milk are all examples of plant-based beverages. Giving variety and different flavours into the product are creating opportunities for the plant-based beverages market.
The presence of alternatives on the market is a significant stumbling block:
Large multinational dairy corporations have invested in technology and expanded their product lines to include plant-based foods, beverages, and coffees. By widening the appeal of their products and utilising novel dairy replacements and methodologies, these companies are focused on plant-based dairy alternatives. Dairies that want to enter the low-acid, plant-based beverage industry need to update their risk assessments and manufacturing procedures to account for the new physical, chemical, and biological dangers, as well as technical challenges, thus this factor is considered as the major challenging factor for the plant-based beverages market.
Plant-based Beverages Market Segment Analysis:
By Source, the market is segmented as Fruit, Soy, Nuts, Rice and Others. Fruit Segment dominated the plant-based beverages market with a 38.2% share in 2023. This is due to a rise in demand for products containing high levels of vitamins, zinc, and iron for proper body health in various countries like India and China. Berries, bananas, grapes, and mangoes are some of the most popular Plant-based fruits beverage among customers. Because of the rise in health-conscious people in many emerging countries such as the United States and the United Kingdom, this category is in great demand and also contributing to fuelling the demand of the market.
However, The Nuts segment is expected to grow at a CAGR of 4.5% through the forecast period. In nations such as the United States, a growth in the penetration of high-nutrition, cholesterol-free plant-based beverage products is expected to stimulate demand for nuts-based beverages. Owing to better taste, low cholesterol, and low fat, as well as an increase in consumer demand for cholesterol-free products in countries like Canada, which is expected to open up lucrative opportunities for the plant-based beverages market.
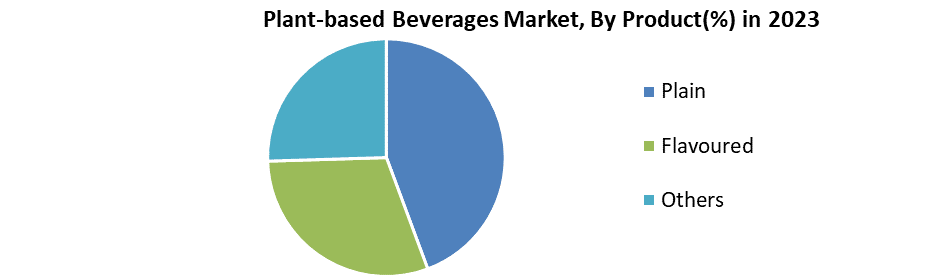
By Product, the market is segmented as Plain, Flavoured and Others. The Plain Product segment dominated the plant-based beverages market with a 59.3% share in 2023. The market is likely to be driven by consumer adoption of highly nutritious plant-based beverages, as well as planned changes in governing regulations to encourage plant-based beverages during the forecast period. The better usage of plain plant-based milk in the variability of beverages is anticipated to increase plant-based beverage trades. Leading firms offer a variety of almond-based, soy-based, coconut-based, oats-based, and rice-based beverages, due to this reason this segment is driving the growth of the market.
However, The Flavoured segment is expected to grow at a CAGR of 5.5% through the forecast period. To encourage the acceptance of beverages in many applications, such as smoothies, protein shakes, yoghurt drinks, and others manufacturers are producing and mixing a variety of flavours. The category is expected to rise due to a rising number of product launches in appealing flavours which are expected to fuel the growth of the plant-based beverages market.
Plant-based Beverages Market Regional Insights:
The North American region dominated the plant-based beverages market with a 40.2% share in 2023. Consumer demand for plant-based foods is on the rise, owing to the health benefits they provide, this has boosted regional demand for plant-based foods. As it contains natural and unique items, this market's demand is growing. Because North America has the greatest market, consumers may readily purchase their products on the internet. Growing consumer health awareness in the United States is resulting in lower sugar and fat consumption, as well as higher protein consumption and overall nutritional balance.
Furthermore, the plant-based beverages market in the region has been driven by increased consumer spending power and the expanding adoption of a vegan diet. Another factor driving market expansion in the United States is a greater focus on fitness among millennials and the younger generation.
The Asia Pacific region is expected to grow at a CAGR of 6.5 % through the forecast period. The region's growing vegan population, particularly millennials preference for plant-based, natural, and healthful foods and beverages, is expected to stimulate demand for plant-based beverages in the Asia Pacific. Countries like China, India, and Thailand have been promoting a healthy lifestyle through consuming nutritious foods.
The objective of the report is to present a comprehensive analysis of the Global Plant-based beverages market to the stakeholders in the industry. The report provides trends that are most dominant in the Global Plant-based beverages market and how these trends will influence new business investments and market development throughout the forecast period. The report also aids in the comprehension of the global market dynamics and competitive structure of the market by analyzing market leaders, market followers, and regional players.
The qualitative and quantitative data provided in the Global Plant-based beverages market report is to help understand which market segments, regions are expected to grow at higher rates, factors affecting the market, and key opportunity areas, which will drive the industry and market growth through the forecast period. The report also includes the competitive landscape of key players in the industry along with their recent developments in the global market. The report studies factors such as company size, market share, market growth, revenue, production volume, and profits of the key players in the global market.
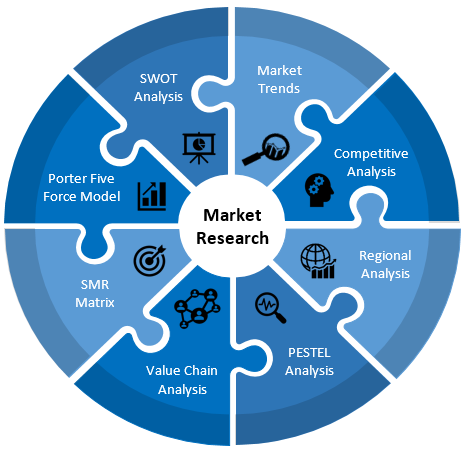
The report provides Porter's Five Force Model, which helps in designing the business strategies in the market. The report helps in identifying how many rivals are existing, who they are, and how their product quality is in the Global Plant-based beverages market. The report also analyses if the Global Plant-based beverages market is easy for a new player to gain a foothold in the market, do they enter or exit the market regularly if the market is dominated by a few Players, etc.
The report also includes a PESTEL Analysis, which aids in the development of company strategies. Political variables help in figuring out how much a government can influence the Global Plant-based beverages market. Economic variables aid in the analysis of economic performance drivers that have an impact on the Global Plant-based beverages market. Understanding the impact of the surrounding environment and the influence of environmental concerns on the Global Plant-based beverages market is aided by legal factors.
Plant-based beverages Market Scope:
|
Plant-based beverages Market |
|
|
Market Size in 2023 |
USD 19.39 Bn. |
|
Market Size in 2030 |
USD 43.42 Bn. |
|
CAGR (2024-2030) |
12.2% |
|
Historic Data |
2018-2022 |
|
Base Year |
2023 |
|
Forecast Period |
2024-2030 |
|
Segment Scope |
By Product
|
|
By Source
|
|
|
Regional Scope |
North America- United States, Canada, and Mexico Europe – UK, France, Germany, Italy, Spain, Sweden, Austria, and Rest of Europe Asia Pacific – China, India, Japan, South Korea, Australia, ASEAN, Rest of APAC Middle East and Africa - South Africa, GCC, Egypt, Nigeria, Rest of the Middle East and Africa South America – Brazil, Argentina, Rest of South America |
Plant-based Beverages Market Key Players:
- Danone S.A (France)
- Pacific Foods of Oregon, LLC (Canada)
- LBlue Diamond Growers, Inc. (U.S)
- SunOpta (Canada)
- The Hain Celestial Group, Inc (New York)
- Freedom Foods Group Ltd. (Australia)
- Califia Farms (U.S)
- Harmless Harvest (California)
- Koia (U.S)
- Vitasoy International Holdings Ltd. (Hong Kong)
- Daiya Foods Inc. (Canada)
- Taifun – Tofu Gmbh (Germany)
- Garden Protein International Inc. (Canada)
- Lightlife Foods Inc. (U.S)
- Axiom Foods (U.S)
Frequently Asked Questions
The North American region is expected to hold the highest share in the Global Plant-based beverages Market.
The market size of the Global Plant-based beverages Market is expected to be 43.42 Bn by 2030.
The forecast period for the Global Plant-based beverages Market is 2024-2030.
The market size of the Global Plant-based beverages Market in 2023 was US$ 19.39 Bn.
Chapter 1 Scope of the Report
Chapter 2 Research Methodology
2.1.Research Process
2.2.Global Plant-based beverages Market: Target Audience
2.3.Global Plant-based beverages Market: Primary Research (As per Client Requirement)
2.4.Global Plant-based beverages Market: Secondary Research
Chapter 3 Executive Summary
Chapter 4 Competitive Landscape
4.1.Market Share Analysis, By Value, 2023-2030
4.1.1.Market Share Analysis, By Region, By Value, 2023-2030 (In %)
4.1.1.1.North America Market Share Analysis, By Value, 2023-2030 (In %)
4.1.1.2.Europe Market Share Analysis, By Value, 2023-2030 (In %)
4.1.1.3.Asia Pacific Market Share Analysis, By Value, 2023-2030 (In %)
4.1.1.4.South America Market Share Analysis, By Value, 2023-2030 (In %)
4.1.1.5.Middle East and Africa Market Share Analysis, By Value, 2023-2030 (In %)
4.1.2.Market Share Analysis, By Product, By Value, 2023-2030 (In %)
4.1.2.1.North America Market Share Analysis, By Product, By Value, 2023-2030 (In %)
4.1.2.1.1.USA Market Share Analysis, By Product, By Value, 2023-2030 (In %)
4.1.2.1.2.Canada Market Share Analysis, By Product, By Value, 2023-2030 (In %)
4.1.2.1.3.Mexico Market Share Analysis, By Product, By Value, 2023-2030 (In %)
4.1.2.2.Europe Market Share Analysis, By Product, By Value, 2023-2030 (In %)
4.1.2.2.1.UK Market Share Analysis, By Product, By Value, 2023-2030 (In %)
4.1.2.2.2.France Market Share Analysis, By Product, By Value, 2023-2030 (In %)
4.1.2.2.3.Germany Market Share Analysis, By Product, By Value, 2023-2030 (In %)
4.1.2.2.4.Italy Market Share Analysis, By Product, By Value, 2023-2030 (In %)
4.1.2.2.5.Spain Market Share Analysis, By Product, By Value, 2023-2030 (In %)
4.1.2.2.6.Sweden Market Share Analysis, By Product, By Value, 2023-2030 (In %)
4.1.2.2.7.Austria Market Share Analysis, By Product, By Value, 2023-2030 (In %)
4.1.2.2.8.Rest of Europe Market Share Analysis, By Product, By Value, 2023-2030 (In %)
4.1.2.3.Asia Pacific Market Share Analysis, By Product, By Value, 2023-2030 (In %)
4.1.2.3.1.China Market Share Analysis, By Product, By Value, 2023-2030 (In %)
4.1.2.3.2.India Market Share Analysis, By Product, By Value, 2023-2030 (In %)
4.1.2.3.3.Japan Market Share Analysis, By Product, By Value, 2023-2030 (In %)
4.1.2.3.4.South Korea Market Share Analysis, By Product, By Value, 2023-2030 (In %)
4.1.2.3.5.Australia Market Share Analysis, By Product, By Value, 2023-2030 (In %)
4.1.2.3.6.ASEAN Market Share Analysis, By Product, By Value, 2023-2030 (In %)
4.1.2.3.7.Rest of APAC Market Share Analysis, By Product, By Value, 2023-2030 (In %)
4.1.2.4.South America Market Share Analysis, By Product, By Value, 2023-2030 (In %)
4.1.2.4.1.Brazil Market Share Analysis, By Product, By Value, 2023-2030 (In %)
4.1.2.4.2.Argentina Market Share Analysis, By Product, By Value, 2023-2030 (In %)
4.1.2.4.3.Rest of South America Market Share Analysis, By Product, By Value, 2023-2030 (In %)
4.1.2.5. Middle East and Africa Market Share Analysis, By Product, By Value, 2023-2030 (In %)
4.1.2.5.1.South Africa Market Share Analysis, By Product, By Value, 2023-2030 (In %)
4.1.2.5.2.GCC Market Share Analysis, By Product, By Value, 2023-2030 (In %)
4.1.2.5.3.Egypt Market Share Analysis, By Product, By Value, 2023-2030 (In %)
4.1.2.5.4.Nigeria Market Share Analysis, By Product, By Value, 2023-2030 (In %)
4.1.2.5.5.Rest of Middle East and Africa Market Share Analysis, By Product, By Value, 2023-2030 (In %)
4.1.3.Market Share Analysis, By Source, By Value, 2023-2030 (In %)
4.1.4.North America Market Share Analysis, By Source, By Value, 2023-2030 (In %)
4.1.4.1.1.USA Market Share Analysis, By Source, By Value, 2023-2030 (In %)
4.1.4.1.2.Canada Market Share Analysis, By Source, By Value, 2023-2030 (In %)
4.1.4.1.3.Mexico Market Share Analysis, By Source, By Value, 2023-2030 (In %)
4.1.4.2.Europe Market Share Analysis, By Source, By Value, 2023-2030 (In %)
4.1.4.2.1.UK Market Share Analysis, By Source, By Value, 2023-2030 (In %)
4.1.4.2.2.France Market Share Analysis, By Source, By Value, 2023-2030 (In %)
4.1.4.2.3.Germany Market Share Analysis, By Source, By Value, 2023-2030 (In %)
4.1.4.2.4.Italy Market Share Analysis, By Source, By Value, 2023-2030 (In %)
4.1.4.2.5.Spain Market Share Analysis, By Source, By Value, 2023-2030 (In %)
4.1.4.2.6.Sweden Market Share Analysis, By Source, By Value, 2023-2030 (In %)
4.1.4.2.7.Austria Market Share Analysis, By Source, By Value, 2023-2030 (In %)
4.1.4.2.8.Rest of Europe Market Share Analysis, By Source, By Value, 2023-2030 (In %)
4.1.4.3.Asia Pacific Market Share Analysis, By Source, By Value, 2023-2030 (In %)
4.1.4.3.1.China Market Share Analysis, By Source, By Value, 2023-2030 (In %)
4.1.4.3.2.India Market Share Analysis, By Source, By Value, 2023-2030 (In %)
4.1.4.3.3.Japan Market Share Analysis, By Source, By Value, 2023-2030 (In %)
4.1.4.3.4.South Korea Market Share Analysis, By Source, By Value, 2023-2030 (In %)
4.1.4.3.5.Australia Market Share Analysis, By Source, By Value, 2023-2030 (In %)
4.1.4.3.6.ASEAN Market Share Analysis, By Source, By Value, 2023-2030 (In %)
4.1.4.3.7.Rest of APAC Market Share Analysis, By Source, By Value, 2023-2030 (In %)
4.1.4.4.South America Market Share Analysis, By Source, By Value, 2023-2030 (In %)
4.1.4.4.1.Brazil Market Share Analysis, By Source, By Value, 2023-2030 (In %)
4.1.4.4.2.Argentina Market Share Analysis, By Source, By Value, 2023-2030 (In %)
4.1.4.4.3.Rest of South America Market Share Analysis, By Source, By Value, 2023-2030 (In %)
4.1.4.5.Middle East and Africa Market Share Analysis, By Source, By Value, 2023-2030 (In %)
4.1.4.5.1.South Africa Market Share Analysis, By Source, By Value, 2023-2030 (In %)
4.1.4.5.2.GCC Market Share Analysis, By Source, By Value, 2023-2030 (In %)
4.1.4.5.3.Egypt Market Share Analysis, By Source, By Value, 2023-2030 (In %)
4.1.4.5.4.Nigeria Market Share Analysis, By Source, By Value, 2023-2030 (In %)
4.1.4.5.5.Rest of Middle East and Africa Market Share Analysis, By Source, By Value, 2023-2030 (In %)
4.2.Stellar Competition matrix
4.2.1.Global Stellar Competition Matrix
4.2.2.North America Stellar Competition Matrix
4.2.3.Europe Stellar Competition Matrix
4.2.4.Asia Pacific Stellar Competition Matrix
4.2.5.South America Stellar Competition Matrix
4.2.6.Middle East and Africa Stellar Competition Matrix
4.3. Key Players Benchmarking
4.3.1.Key Players Benchmarking by Product, Pricing, Market Share, Investments, Expansion Plans, Physical Presence and Presence in the Market.
4.4. Mergers and Acquisitions in Industry
4.4.1.M&A by Region, Value and Strategic Intent
4.5.Market Dynamics
4.5.1.Market Drivers
4.5.2.Market Restraints
4.5.3.Market Opportunities
4.5.4.Market Challenges
4.5.5.PESTLE Analysis
4.5.6.PORTERS Five Force Analysis
4.5.7.Value Chain Analysis
Chapter 5 Global Plant-based beverages Market Segmentation: By Product Type
5.1.Global Plant-based beverages Market, By Product Type, Overview/Analysis, 2023-2030
5.2.Global Plant-based beverages Market, By Product Type, By Value, Market Share (%), 2023-2030 (USD Million)
5.3.Global Plant-based beverages Market, By Product Type, By Value, -
5.3.1.Plain
5.3.2.Flavoured
5.3.3.Others
Chapter 6 Global Plant-based beverages Market Segmentation: By Source
6.1.Global Plant-based beverages Market, By Source, Overview/Analysis, 2023-2030
6.2.Global Plant-based beverages Market Size, By Source, By Value, Market Share (%), 2023-2030 (USD Million)
6.3.Global Plant-based beverages Market, By Source, By Value, -
6.3.1.Fruit
6.3.2.Soy
6.3.3.Nuts
6.3.4.Rice
6.3.5.Others
Chapter 7 Global Plant-based beverages Market Segmentation: By Region
7.1.Global Plant-based beverages Market, By Region – North America
7.1.1.North America Plant-based beverages Market Size, By Product Type, By Value, 2023-2030 (USD Million)
7.1.2.North America Plant-based beverages Market Size, By Source, By Value, 2023-2030 (USD Million)
7.1.3.By Country – U.S.
7.1.3.1.U.S.Plant-based beverages Market Size, By Product Type, By Value, 2023-2030 (USD Million)
7.1.3.2.U.S.Plant-based beverages Market Size, By Source, By Value, 2023-2030 (USD Million)
7.1.3.3.Canada Plant-based beverages Market Size, By Value, 2023-2030 (USD Million)
7.1.3.4.Mexico Plant-based beverages Market Size, By Value, 2023-2030 (USD Million)
7.2.Europe Plant-based beverages Market Size, By Value, 2023-2030 (USD Million)
7.2.1.UK
7.2.2.France
7.2.3.Germany
7.2.4.Italy
7.2.5.Spain
7.2.6.Sweden
7.2.7.Austria
7.2.8.Rest of Europe
7.3.Asia Pacific Plant-based beverages Market Size, By Value, 2023-2030 (USD Million)
7.3.1.China
7.3.2.India
7.3.3.Japan
7.3.4.South Korea
7.3.5.Australia
7.3.6.ASEAN
7.3.7.Rest of APAC
7.4.Middle East and Africa Plant-based beverages Market Size, By Value, 2023-2030 (USD Million)
7.4.1.South Africa
7.4.2.GCC
7.4.3.Egypt
7.4.4.Nigeria
7.4.5.Rest of Middle East and Africa
7.5.South America Plant-based beverages Market Size, By Value, 2023-2030 (USD Million)
7.5.1.Brazil
7.5.2.Argentina
7.5.3.Rest of South America
Chapter 8 Company Profiles
8.1.Key Players
8.1.1.Danone S.A (France)
8.1.1.1.Company Overview
8.1.1.2.Product Portfolio
8.1.1.3.Financial Overview
8.1.1.4.Business Strategy
8.1.1.5.Key Developments
8.1.2.Pacific Foods of Oregon, LLC (Canada)
8.1.3.LBlue Diamond Growers, Inc. (U.S)
8.1.4.SunOpta (Canada)
8.1.5.The Hain Celestial Group, Inc (New York)
8.1.6.Freedom Foods Group Ltd. (Australia)
8.1.7.Califia Farms (U.S)
8.1.8.Harmless Harvest (California)
8.1.9.Koia (U.S)
8.1.10.Vitasoy International Holdings Ltd. (Hong Kong)
8.1.11.Daiya Foods Inc. (Canada)
8.1.12.Taifun – Tofu Gmbh (Germany)
8.1.13.Garden Protein International Inc. (Canada)
8.1.14.Lightlife Foods Inc. (U.S)
8.1.15.Axiom Foods (U.S)
8.2.Key Findings
8.3.Recommendations


