Homeland Security and Emergency Management Market - Global Industry Analysis and Forecast 2026-2034 Size, Share, Growth, Trend
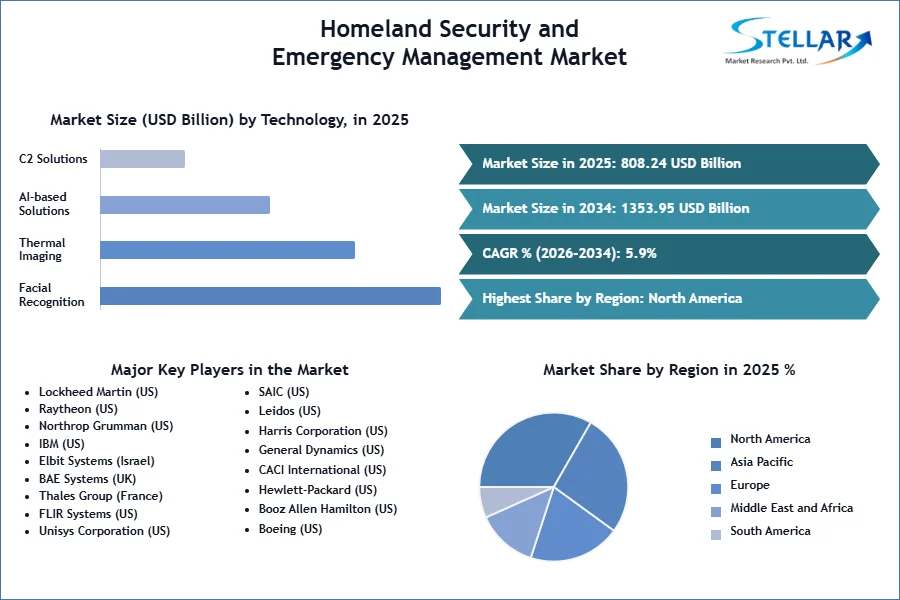
The Homeland Security and Emergency Management Market size was valued at USD 808.24 Bn. in 2025. The global Homeland Security and Emergency Management Market are estimated to grow at a CAGR of 5.9% over the forecast period.
Homeland Security and Emergency Management Market Overview:
As the number of people with radicalized thought has grown, so has the number of civilian lives at stake. The need for dual-use technologies and the difficulty in locating them has resulted in an increase in demand for technology that assists in monitoring individuals, communities, urban areas, businesses, and organizations. The Homeland Security and Emergency Management spot important threats, assess intelligence, respond to catastrophes and emergency situations, as well as the administrative obligations and laws that come with working in the field of homeland security. Homeland Security and Emergency Management employ machinery, software, and humans to monitor, identify, analyze, and eradicate dangers to human life. The same equipment that is used to detect threats can also be utilized to aid in disaster relief operations resulting from environmental issues.
To get more Insights: Request Free Sample Report
Homeland Security and Emergency Management Market Dynamics:
Growing Dissensions in Politics and Separatist Movements across the Globe:
Various separatist groups are still active and armed around the world, posing a threat to the countries where they occur. In the Middle East, Europe, and the Asia Pacific, separatist movements are growing more widespread. Countless millions of dollars are being spent by governments on homeland security and emergency response personnel.
For example, Due to recent wars and a reduction in oil prices, countries such as Saudi Arabia, Bahrain, and Iran have increased their investment in homeland security and emergency management. Djibouti, Ethiopia, Kenya, Eritrea, and Somalia, for example, have been tormented by violent strife for decades. Armed confrontations between terrorists and states affect African countries more than state-based armed conflicts.
Growing Urbanisation and Globalisation across the Globe:
As a result of globalization and urbanization, people have been forced from their original lands into foreign lands. As a result, there have been increasing clashes between relocated people and the local population. Homeland Security uses advanced auditory, optical, and cyber techniques to monitor people's ideas and viewpoints. Due to an increase in the concern of people being transferred, the Homeland Security and Emergency Management Market has grown.
Rising Terrorist Threats and Biohazard Warfare:
The military sector is becoming increasingly concerned about emergency circumstances as the world becomes more unstable as a result of escalating terrorist attacks and criminal activity. These plans of action include procedures for dealing with critical situations like hazardous material spills, chemical attacks, civil unrest, and even deliberate attacks like biological attacks, local attacks, pandemic attacks, explosives, toxic industrial chemicals, radiological attacks, and nuclear attacks. The act of releasing bacteria, viruses, poisons, and human-modified dangerous substances that endanger people and infrastructure is known as bioterrorism.
Terrorists throughout the world are increasingly committing transnational organized crimes in order to raise funds and obtain logistical support in order to carry out cross-border terrorist attacks and other violent acts against civilians. Several governments and security agencies are eager to put security measures in place, as well as solid emergency and event management systems and solutions. The homeland security and emergency management technologies should aid in the detection and evaluation of biological, radiological, chemical, nuclear, or explosive materials. As a result, calamities would be less likely.
Growing Adoption of Cloud-Based Applications and Services:
Cloud-based security solutions are gradually gaining traction as the most popular method of achieving IT security goals. Several firms, including HPE, Symantec, McAfee, IBM, and Cisco, offer cybersecurity solutions via a cloud-based Software-as-a-Service (SaaS) delivery model. Such cloud-based solutions provide a centralized mechanism to safeguard online and mobile apps, as well as networks, across the company during the development, production, and implementation phases. The SaaS-based approach is easier and more efficient than the on-premises deployment technique since it gives greater flexibility and scalability for solution deployments. As more applications are moved to the cloud, large organizations and SMEs are transitioning from traditional on-premises cybersecurity solutions to cloud-based solutions.
Emergency Management Action Plans are Given a Low Priority:
Natural and man-made disasters, along with their aftermaths, have the ability to significantly alter a community's, state's, or nation's political environment. Following a disaster, players at all levels of government must work together to establish general priorities and objectives for disaster recovery. An emergency management action plan must be implemented to deal with the critical conditions that arise as a result of critical incidents. However, because there are several politicians engaged, poor response to operations can lead to uncertainty in decision-making and postpone the implementation of incident management solutions.
Low Investment allocations, insufficient training, failure to execute standard operating procedures (SOPs), and political pressure are only a few of the causes that contribute to bad emergency management.
Homeland Security and Emergency Management Market Segment Analysis:
By Solution, the Homeland Security and Emergency Management Market are segmented into Systems and Services. The System segment dominated the market with a 68.5% share in 2025. The segment growth is attributed to consistently growing worldwide threats. One of the primary aspects driving the growth of the systems segment is the increased demand for non-lethal weapons used to control riot situations. In addition, the segment's growth is being fueled by an increase in the acquisition of new homeland security systems by various law enforcement agencies across the globe.
By End Use, the Homeland Security and Emergency Management Market is segmented into Cybersecurity, Aviation Security, Maritime Security, Law Enforcement & Intelligence Gathering, Critical Infrastructure Security, Risk & Emergency Services, Border Security, and Cbrne Security. The Cybersecurity Segment is expected to grow at a significant CAGR of 6.2% during the forecast period. Organizations' rising use of web and mobile apps is expected to propel the cybersecurity market forward. Advanced cybersecurity products ensure the confidentiality, integrity, and availability of important business applications by providing complete security. Network security, endpoint security, application security, cloud security, wireless security, and others are the six key categories of cybersecurity that are boosting the growth of the segment.
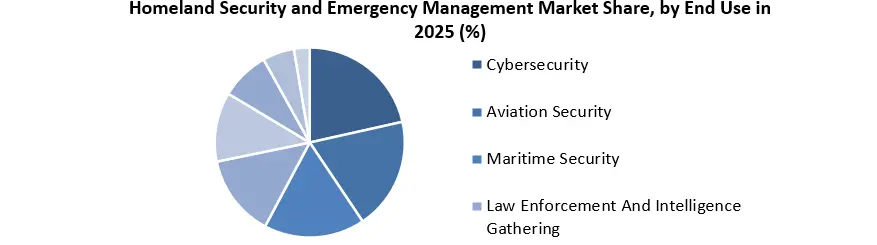
NTT DATA Services Federal Government, a public sector subsidiary of NTT DATA Services, was awarded a US$ 23.3 million task order to support the US Department of Homeland Security's (DHS) Cybersecurity Infrastructure Security Agency (CISA) and Cybersecurity Division under NTT DATA's General Services Administration multiple award schedule contract in November 2020.
Homeland Security and Emergency Management Market Regional Insights:
The North American region dominated the market with a 48.1% share in 2025. The region’s growth is attributed to the United States and Canadian governments' efforts in homeland security and public safety. The US government boosted its budget allocation for homeland security by nearly 24% in the fiscal year 2020 compared to the previous fiscal year, allocating USD 92.07 billion for the fiscal year. In addition, the country is investing in numerous first responders and agencies through the Disaster Relief Fund to take proper actions in the case of a disaster (DRF). Due to the country's vulnerability to earthquakes, avalanches, tsunamis, hurricanes, and other natural disasters, such investments are expected to mitigate risk and damage, hence helping the market's growth in this region over the forecast period.
The objective of the report is to present a comprehensive analysis of the Global Homeland Security and Emergency Management Market to the stakeholders in the industry. The report provides trends that are most dominant in the Global Homeland Security and Emergency Management Market and how these trends will influence new business investments and market development throughout the forecast period. The report also aids in the comprehension of the Global Homeland Security and Emergency Management Market dynamics and competitive structure of the market by analyzing market leaders, market followers, and regional players.
The qualitative and quantitative data provided in the Global Homeland Security and Emergency Management Market report is to help understand which market segments, regions are expected to grow at higher rates, factors affecting the market, and key opportunity areas, which will drive the industry and market growth through the forecast period. The report also includes the competitive landscape of key players in the industry along with their recent developments in the Global Homeland Security and Emergency Management Market. The report studies factors such as company size, market share, market growth, revenue, production volume, and profits of the key players in the Global Homeland Security and Emergency Management Market.
The report provides Porter's Five Force Model, which helps in designing the business strategies in the market. The report helps in identifying how many rivals are existing, who they are, and how their product quality is in the Global Homeland Security and Emergency Management Market. The report also analyses if the Global Homeland Security and Emergency Management Market is easy for a new player to gain a foothold in the market, do they enter or exit the market regularly if the market is dominated by a few players, etc.
The report also includes a PESTEL Analysis, which aids in the development of company strategies. Political variables help in figuring out how much a government can influence the Global Homeland Security and Emergency Management Market. Economic variables aid in the analysis of economic performance drivers that have an impact on the Global Homeland Security and Emergency Management Market. Understanding the impact of the surrounding environment and the influence of environmental concerns on the Global Homeland Security and Emergency Management Market is aided by legal factors.
Homeland Security and Emergency Management Market Scope:
|
Homeland Security and Emergency Management Market |
|
|
Market Size in 2025 |
USD 808.24 Bn. |
|
Market Size in 2034 |
USD 1353.95 Bn. |
|
CAGR (2026-2034) |
5.9% |
|
Historic Data |
2020-2025 |
|
Base Year |
2025 |
|
Forecast Period |
2026-2034 |
|
Segment Scope |
by Installation
|
|
by Technology
|
|
|
by Solution
|
|
|
by End-Use
|
|
|
Regional Scope |
North America- United States, Canada, and Mexico Europe – UK, France, Germany, Italy, Spain, Sweden, Austria, and Rest of Europe Asia Pacific – China, India, Japan, South Korea, Australia, ASEAN, Rest of APAC Middle East and Africa - South Africa, GCC, Egypt, Nigeria, Rest of the Middle East and Africa South America – Brazil, Argentina, Rest of South America |
Homeland Security and Emergency Management Market Key Players:
- Lockheed Martin (US)
- Raytheon (US)
- Northrop Grumman (US)
- IBM (US)
- Elbit Systems (Israel)
- BAE Systems (UK)
- Thales Group (France)
- FLIR Systems (US)
- Unisys Corporation (US)
- SAIC (US)
- Leidos (US)
- Harris Corporation (US)
- General Dynamics (US)
- CACI International (US)
- Hewlett-Packard (US)
- Booz Allen Hamilton (US)
- Boeing (US)
Frequently Asked Questions
The North American region is expected to hold the highest share in the Homeland Security and Emergency Management Market.
The market size of the Homeland Security and Emergency Management Market by 2034 is expected to reach at USD 1353.95 Bn.
The forecast period for the Homeland Security and Emergency Management Market is 2026-2034
The market size of the Homeland Security and Emergency Management Market in 2025 was valued at USD 808.24 Bn.
1. Research Methodology
1.1 Research Data
1.1.1. Primary Data
1.1.2. Secondary Data
1.2. Market Size Estimation
1.2.1. Bottom-Up Approach
1.2.2. Top-Down Approach
1.3. Market Breakdown and Data Triangulation
1.4. Research Assumption
2. Homeland Security and Emergency Management Market Executive Summary
2.1. Market Overview
2.2. Market Size (2025) and Forecast (2025– 2034) and Y-O-Y%
2.3. Market Size (USD) and Market Share (%) – By Segments and Regions
3. Global Homeland Security and Emergency Management Market: Competitive Landscape
3.1. SMR Competition Matrix
3.2. Key Players Benchmarking
3.2.1. Company Name
3.2.2. Headquarter
3.2.3. Service Segment
3.2.4. End-user Segment
3.2.5. Y-O-Y%
3.2.6. Revenue (2025)
3.2.7. Profit Margin
3.2.8. Market Share
3.2.9. Company Locations
3.3. Market Structure
3.3.1. Market Leaders
3.3.2. Market Followers
3.3.3. Emerging Players
3.4. Consolidation of the Market
3.4.1. Strategic Initiatives and Developments
3.4.2. Mergers and Acquisitions
3.4.3. Collaborations and Partnerships
3.4.4. Service Launches and Innovations
4. Homeland Security and Emergency Management Market: Dynamics
4.1. Homeland Security and Emergency Management Market Trends by Region
4.1.1. North America
4.1.2. Europe
4.1.3. Asia Pacific
4.1.4. Middle East and Africa
4.1.5. South America
4.2. Homeland Security and Emergency Management Market Drivers
4.3. Homeland Security and Emergency Management Market Restraints
4.4. Homeland Security and Emergency Management Market Opportunities
4.5. Homeland Security and Emergency Management Market Challenges
4.6. PORTER’s Five Forces Analysis
4.6.1. Intensity of the Rivalry
4.6.2. Threat of New Entrants
4.6.3. Bargaining Power of Suppliers
4.6.4. Bargaining Power of Buyers
4.6.5. Threat of Substitutes
4.7. PESTLE Analysis
4.7.1. Political Factors
4.7.2. Economic Factors
4.7.3. Social Factors
4.7.4. Technological Factor
4.7.5. Legal Factors
4.7.6. Environmental Factors
4.8. Technological Roadmap
4.9. Regulatory Landscape
4.9.1. Market Regulation by Region
4.9.1.1. North America
4.9.1.2. Europe
4.9.1.3. Asia Pacific
4.9.1.4. Middle East and Africa
4.9.1.5. South America
4.9.2. Impact of Regulations on Market Dynamics
4.9.3. Government Schemes and Initiatives
5. Homeland Security and Emergency Management Market: Global Market Size and Forecast by Segmentation (by Value in USD Billion) (2025-2034)
5.1. Homeland Security and Emergency Management Market Size and Forecast, by Installation (2025-2034)
5.1.1. New Installation
5.1.2. Upgrade
5.2. Homeland Security and Emergency Management Market Size and Forecast, by Technology (2025-2034)
5.2.1. Facial Recognition Cameras
5.2.2. Thermal Imaging Technology
5.2.3. AI-based Solutions
5.2.4. C2 Solutions
5.2.5. Blockchain Solutions
5.2.6. Others
5.3. Homeland Security and Emergency Management Market Size and Forecast, by Solution (2025-2034)
5.3.1. Systems
5.3.2. Services
5.4. Homeland Security and Emergency Management Market Size and Forecast, by End-Use (2025-2034)
5.4.1. Cybersecurity
5.4.2. Aviation Security
5.4.3. Maritime Security
5.4.4. Law Enforcement And Intelligence Gathering
5.4.5. Critical Infrastructure Security
5.4.6. Risk And Emergency Services
5.4.7. Border Security
5.4.8. Cbrne Security
5.5. Homeland Security and Emergency Management Market Size and Forecast, by Region (2025-2034)
5.5.1. North America
5.5.2. Europe
5.5.3. Asia Pacific
5.5.4. Middle East and Africa
5.5.5. South America
6. North America Homeland Security and Emergency Management Market Size and Forecast by Segmentation (by Value in USD Billion) (2025-2034)
6.1. North America Homeland Security and Emergency Management Market Size and Forecast, by Installation (2025-2034)
6.1.1. New Installation
6.1.2. Upgrade
6.2. North America Homeland Security and Emergency Management Market Size and Forecast, by Technology (2025-2034)
6.2.1. Facial Recognition Cameras
6.2.2. Thermal Imaging Technology
6.2.3. AI-based Solutions
6.2.4. C2 Solutions
6.2.5. Blockchain Solutions
6.2.6. Others
6.3. North America Homeland Security and Emergency Management Market Size and Forecast, by Solution (2025-2034)
6.3.1. Systems
6.3.2. Services
6.4. North America Homeland Security and Emergency Management Market Size and Forecast, by End-Use (2025-2034)
6.4.1. Cybersecurity
6.4.2. Aviation Security
6.4.3. Maritime Security
6.4.4. Law Enforcement And Intelligence Gathering
6.4.5. Critical Infrastructure Security
6.4.6. Risk And Emergency Services
6.4.7. Border Security
6.4.8. Cbrne Security
6.5. North America Homeland Security and Emergency Management Market Size and Forecast, by Country (2025-2034)
6.5.1. United States
6.5.2. Canada
6.5.3. Mexico
7. Europe Homeland Security and Emergency Management Market Size and Forecast by Segmentation (by Value in USD Billion) (2025-2034)
7.1. Europe Homeland Security and Emergency Management Market Size and Forecast, by Installation (2025-2034)
7.2. Europe Homeland Security and Emergency Management Market Size and Forecast, by Technology (2025-2034)
7.3. Europe Homeland Security and Emergency Management Market Size and Forecast, by Solution (2025-2034)
7.4. Europe Homeland Security and Emergency Management Market Size and Forecast, by End-Use (2025-2034)
7.5. Europe Homeland Security and Emergency Management Market Size and Forecast, by Country (2025-2034)
7.5.1. United Kingdom
7.5.2. France
7.5.3. Germany
7.5.4. Italy
7.5.5. Spain
7.5.6. Sweden
7.5.7. Austria
7.5.8. Rest of Europe
8. Asia Pacific Homeland Security and Emergency Management Market Size and Forecast by Segmentation (by Value in USD Billion) (2025-2034)
8.1. Asia Pacific Homeland Security and Emergency Management Market Size and Forecast, by Installation (2025-2034)
8.2. Asia Pacific Homeland Security and Emergency Management Market Size and Forecast, by Technology (2025-2034)
8.3. Asia Pacific Homeland Security and Emergency Management Market Size and Forecast, by Solution (2025-2034)
8.4. Asia Pacific Homeland Security and Emergency Management Market Size and Forecast, by End-Use (2025-2034)
8.5. Asia Pacific Homeland Security and Emergency Management Market Size and Forecast, by Country (2025-2034)
8.5.1. China
8.5.2. S Korea
8.5.3. Japan
8.5.4. India
8.5.5. Australia
8.5.6. Indonesia
8.5.7. Malaysia
8.5.8. Vietnam
8.5.9. Taiwan
8.5.10. Rest of Asia Pacific
9. Middle East and Africa Homeland Security and Emergency Management Market Size and Forecast by Segmentation (by Value in USD Billion) (2025-2034)
9.1. Middle East and Africa Homeland Security and Emergency Management Market Size and Forecast, by Installation (2025-2034)
9.2. Middle East and Africa Homeland Security and Emergency Management Market Size and Forecast, by Technology (2025-2034)
9.3. Middle East and Africa Homeland Security and Emergency Management Market Size and Forecast, by Solution (2025-2034)
9.4. Middle East and Africa Homeland Security and Emergency Management Market Size and Forecast, by End-Use (2025-2034)
9.5. Middle East and Africa Homeland Security and Emergency Management Market Size and Forecast, by Country (2025-2034)
9.5.1. South Africa
9.5.2. GCC
9.5.3. Nigeria
9.5.4. Rest of ME&A
10. South America Homeland Security and Emergency Management Market Size and Forecast by Segmentation (by Value in USD Billion) (2025-2034)
10.1. South America Homeland Security and Emergency Management Market Size and Forecast, by Installation (2025-2034)
10.2. South America Homeland Security and Emergency Management Market Size and Forecast, by Technology (2025-2034)
10.3. South America Homeland Security and Emergency Management Market Size and Forecast, by Solution (2025-2034)
10.4. South America Homeland Security and Emergency Management Market Size and Forecast, by End-Use (2025-2034)
10.5. South America Homeland Security and Emergency Management Market Size and Forecast, by Country (2025-2034)
10.5.1. Brazil
10.5.2. Argentina
10.5.3. Rest Of South America
11. Company Profile: Key Players
11.1. Lockheed Martin (US)
11.1.1. Company Overview
11.1.2. Business Portfolio
11.1.3. Financial Overview
11.1.3.1. Total Revenue
11.1.3.2. Segment Revenue
11.1.3.3. Regional Revenue
11.1.4. SWOT Analysis
11.1.5. Strategic Analysis
11.1.6. Recent Developments
11.2. Raytheon (US)
11.3. Northrop Grumman (US)
11.4. IBM (US)
11.5. Elbit Systems (Israel)
11.6. BAE Systems (UK)
11.7. Thales Group (France)
11.8. FLIR Systems (US)
11.9. Unisys Corporation (US)
11.10. SAIC (US)
11.11. Leidos (US)
11.12. Harris Corporation (US)
11.13. General Dynamics (US)
11.14. CACI International (US)
11.15. Hewlett-Packard (US)
11.16. Booz Allen Hamilton (US)
11.17. Boeing (US)
12. Key Findings
13. Analyst Recommendations
13.1. Strategic Recommendations
13.2. Future Outlook