Global White Goods Market: Industry Analysis and Forecast 2030
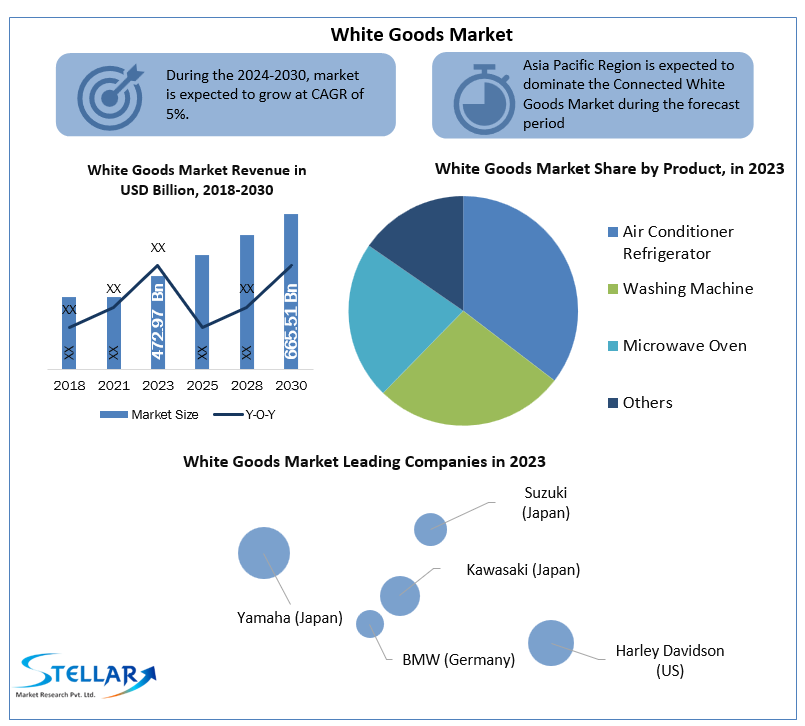
Global White Goods Market was valued at US$ 472.97 Bn. in 2023. Global White Goods Market size is estimated to grow at a CAGR of 5%.
Format : PDF | Report ID : SMR_261
White Goods Market Definition:
Refrigerators, freezers, washing machines, dishwashers, and air conditioners are examples of major home and business white goods. They are big electrical appliances for residential and commercial use that are usually exclusively available in white. Despite the fact that they are now available in a variety of hues, they are still referred to as white goods. The white goods market report is analysed and studied, based on the product, distribution channel and region segment.
White Goods Market Dynamics:
Changes in the environment are rapidly increasing the demand for disposable income, urbanization and human comfort. These factors are driving the market growth of the white goods market.
Increasing demand for energy-saving home appliances and increased product sales led to the expansion of home appliance manufacturing bases in developing countries and supported the growth of the home appliance market.
Advanced technology products based on artificial intelligence and the Internet of Things have created new opportunities in the market, and AI-based refrigerators have helped the market growth of home appliances.
Higher living standards and the need for convenience have led consumers to upgrade their existing devices to smarter versions because they are simpler, hassle-free and save time. Effectiveness, sustainability, stylish design and smart functionality are the drivers of the white goods market.
Advances in technology have led to the development of smart devices. Product differentiation and integration of many value-added services such as Wi-Fi and Bluetooth can be used on or accessed from smartphones and tablets. Improves network infrastructure and internet penetration.
Consumers are increasingly choosing wireless and technologically advanced products for convenience. Due to these factors, the demand for white goods is increasing. Sustainable and energy efficient products that combine high quality materials and aesthetically pleasing designs with innovative and versatile features. Design is one of the most important aspects of purchasing a product. These are the factors that drive product sales and white goods market growth.
Prevalence to undertake clever home equipment amongst clients especially in evolved and growing nations is driving the white goods market. Growing expenditure and growing economic system are moreover boosting the white goods market. White goods are enhancing lifestyles requirements which can be why many human beings are adopting clever domestic home equipment like dishwashers, washing machines, and others. This characteristic is quietly leveraging the increase demand of the market.
Key gamers are closely making an investment with inside the production of numerous packages in prefer of the end-person is driving the white goods market. Some industries like hospitals & clinics are broadly the usage of a number of the white goods is probably to reinforce the increase charge of the marketplace. Increasing twin operating households the world over is improving the marketplace call for. The emergence of loT anywhere is thriving the increase charge of the white items marketplace shares.
However, the high cost of installing and maintaining the latest applications is hampering white goods market demand. Rising commodity prices due to supply chain fluctuations are slowing the growth rate of market. In addition, strict government rules and regulations in approving new applications are gradually reducing demand in this market. The lack of complete knowledge of the availability of various applications in developing countries is a major challenge for market players.

White Goods Market Segment Analysis:
By Product, Refrigerators dominated the white goods market in 2023, with a 33% share. The factors driving the market expansion of the category are a safe, easy, and convenient way to preserve food and food products, as well as an increase in nuclear households. The segment's demand is further boosted by the emergence of smart and energy-efficient refrigerators.
Through the forecast period, the air conditioner is expected to increase at a CAGR of 7 %. Climate change is wreaking havoc on weather patterns, while urbanisation and commercial multiplexes, smart cities, and green buildings are all on the rise. Through the expected forecast period, these factors are expected to fuel the rise of air conditioners.
By Distribution Channel, Specialty stores dominated the white goods market with a 36.2 % share in 2023 for Distribution Channel. The expansion of the segment in the market is being driven by a focus on a specific type of product category, as well as the ability to compare features and appearance between different brands. After-sales services, spare parts availability, and other factors are also propelling the market forward.
Through the projected period, e-commerce is expected to grow at a CAGR of 8.1 %. High internet and smartphone penetration, technical developments, home delivery, return policies, and other factors are expected to drive market growth through the forecast period.
White Goods Market Regional Insights:
In 2023, the Asia Pacific Region dominated the market with a 41 % share. Market expansion in this region is fueled by the presence of significant manufacturers, increased investment, and rising industrialisation. White goods demand is increasing as the standard of life rises, disposable income rises, and home improvement spending rises. The expansion of the white goods market in the Asia Pacific region is being driven by rising population, awareness of smart cities, and smart integrated appliances in nations such as China, Japan, India, and others.
With a CAGR of 4% through the forecast period, North America is expected to lead the market. Also the primary variables projected include an increase in the launch of new technologies, a surge in government support and initiatives, and increased household demand for goods in this region.
The objective of the report is to present a comprehensive analysis of the Global White Goods market to the stakeholders in the industry. The report provides trends that are most dominant in the Global White Goods market and how these trends will influence new business investments and market development throughout the forecast period. The report also aids in the comprehension of the Global White Goods Market dynamics and competitive structure of the market by analyzing market leaders, market followers, and regional players.
The qualitative and quantitative data provided in the Global White Goods market report is to help understand which market segments, regions are expected to grow at higher rates, factors affecting the market, and key opportunity areas, which will drive the industry and market growth through the forecast period. The report also includes the competitive landscape of key players in the industry along with their recent developments in the Global White Goods market. The report studies factors such as company size, market share, market growth, revenue, production volume, and profits of the key players in the Global market.
The report provides Porter's Five Force Model, which helps in designing the business strategies in the market. The report helps in identifying how many rivals are existing, who they are, and how their product quality is in the Global White Goods market. The report also analyses if the Global market is easy for a new player to gain a foothold in the market, do they enter or exit the market regularly if the market is dominated by a few players, etc.
The report also includes a PESTEL Analysis, which aids in the development of company strategies. Political variables help in figuring out how much a government can influence the Global White Goods market. Economic variables aid in the analysis of economic performance drivers that have an impact on the global White Goods market. Understanding the impact of the surrounding environment and the influence of environmental concerns on the global market is aided by legal factors.
White Goods Market Scope
|
Global White Goods Market |
|
|
Market Size in 2023 |
USD 472.97 Bn. |
|
Market Size in 2030 |
USD 665.51Bn. |
|
CAGR (2024-2030) |
5 Percent |
|
Historic Data |
2018-2022 |
|
Base Year |
2023 |
|
Forecast Period |
2024-2030 |
|
Segment Scope |
by Product
|
|
by Distribution Channel
|
|
|
Regional Scope |
North America- United States, Canada, and Mexico
Europe – UK, France, Germany, Italy, Spain, Sweden, Austria, and Rest of Europe Asia Pacific – China, India, Japan, South Korea, Australia, ASEAN, Rest of APAC Middle East and Africa - South Africa, GCC, Egypt, Nigeria, Rest of the Middle East and Africa South America – Brazil, Argentina, Rest of South America |
White Goods Market Key Players:
- Whirlpool Corporation
- Panasonic Corporation
- IFB Industries
- Samsung
- Sharp Corporation
- LG Electronics
- Hitachi, Ltd
- Robert Bosch GMBH
- Symphony Limited
- Blue Star Limited
- Godrej & Boyce Mfg. Co. Ltd.
- AB Electrolux
- Haier Inc.
- Midea Group
- Siemens
- TCL Corporation
- Mitsubishi Electric Corporation
- Johnson Controls
Frequently Asked Questions
Asia Pacific region is expected to hold the highest share in the global market.
The forecast period for the White Goods Market is 2024-2030.
The market size of the White Goods Market by 2030 is expected to reach US$ 665.51 Bn.
The market size of the White Goods Market in 2023 was valued at US$ 472.97 Bn.
Chapter 1 Scope of the Report
Chapter 2 Research Methodology
2.1. Research Process
2.2. Global White Goods Market: Target Audience
2.3. Global White Goods Market: Primary Research (As per Client Requirement)
2.4. Global White Goods Market: Secondary Research
Chapter 3 Executive Summary
Chapter 4 Competitive Landscape
4.1. Market Share Analysis, By Value, 2023-2030
4.1.1. Market Share Analysis, By Region, By Value, 2023-2030 (In %)
4.1.1.1. North America Market Share Analysis, By Value, 2023-2030 (In %)
4.1.1.2. Europe Market Share Analysis, By Value, 2023-2030 (In %)
4.1.1.3. Asia Pacific Market Share Analysis, By Value, 2023-2030 (In %)
4.1.1.4. South America Market Share Analysis, By Value, 2023-2030 (In %)
4.1.1.5. Middle East and Africa Market Share Analysis, By Value, 2023-2030 (In %)
4.1.2. Market Share Analysis, By Product, By Value, 2023-2030 (In %)
4.1.2.1. North America Market Share Analysis, By Product, By Value, 2023-2030 (In %)
4.1.2.1.1. USA Market Share Analysis, By Product, By Value, 2023-2030 (In %)
4.1.2.1.2. Canada Market Share Analysis, By Product, By Value, 2023-2030 (In %)
4.1.2.1.3. Mexico Market Share Analysis, By Product, By Value, 2023-2030 (In %)
4.1.2.2. Europe Market Share Analysis, By Product, By Value, 2023-2030 (In %)
4.1.2.2.1. UK Market Share Analysis, By Product, By Value, 2023-2030 (In %)
4.1.2.2.2. France Market Share Analysis, By Product, By Value, 2023-2030 (In %)
4.1.2.2.3. Germany Market Share Analysis, By Product, By Value, 2023-2030 (In %)
4.1.2.2.4. Italy Market Share Analysis, By Product, By Value, 2023-2030 (In %)
4.1.2.2.5. Spain Market Share Analysis, By Product, By Value, 2023-2030 (In %)
4.1.2.2.6. Sweden Market Share Analysis, By Product, By Value, 2023-2030 (In %)
4.1.2.2.7. Austria Market Share Analysis, By Product, By Value, 2023-2030 (In %)
4.1.2.2.8. Rest of Europe Market Share Analysis, By Product, By Value, 2023-2030 (In %)
4.1.2.3. Asia Pacific Market Share Analysis, By Product, By Value, 2023-2030 (In %)
4.1.2.3.1. China Market Share Analysis, By Product, By Value, 2023-2030 (In %)
4.1.2.3.2. India Market Share Analysis, By Product, By Value, 2023-2030 (In %)
4.1.2.3.3. Japan Market Share Analysis, By Product, By Value, 2023-2030 (In %)
4.1.2.3.4. South Korea Market Share Analysis, By Product, By Value, 2023-2030 (In %)
4.1.2.3.5. Australia Market Share Analysis, By Product, By Value, 2023-2030 (In %)
4.1.2.3.6. ASEAN Market Share Analysis, By Product, By Value, 2023-2030 (In %)
4.1.2.3.7. Rest of APAC Market Share Analysis, By Product, By Value, 2023-2030 (In %)
4.1.2.4. South America Market Share Analysis, By Product, By Value, 2023-2030 (In %)
4.1.2.4.1. Brazil Market Share Analysis, By Product, By Value, 2023-2030 (In %)
4.1.2.4.2. Argentina Market Share Analysis, By Product, By Value, 2023-2030 (In %)
4.1.2.4.3. Rest of South America Market Share Analysis, By Product, By Value, 2023-2030 (In %)
4.1.2.5. Middle East and Africa Market Share Analysis, By Product, By Value, 2023-2030 (In %)
4.1.2.5.1. South Africa Market Share Analysis, By Product, By Value, 2023-2030 (In %)
4.1.2.5.2. GCC Market Share Analysis, By Product, By Value, 2023-2030 (In %)
4.1.2.5.3. Egypt Market Share Analysis, By Product, By Value, 2023-2030 (In %)
4.1.2.5.4. Nigeria Market Share Analysis, By Product, By Value, 2023-2030 (In %)
4.1.2.5.5. Rest of Middle East and Africa Market Share Analysis, By Product, By Value, 2023-2030 (In %)
4.1.3. Market Share Analysis, By Distribution Channel, By Value, 2023-2030 (In %)
4.1.4. North America Market Share Analysis, By Distribution Channel, By Value, 2023-2030 (In %)
4.1.4.1.1. USA Market Share Analysis, By Distribution Channel, By Value, 2023-2030 (In %)
4.1.4.1.2. Canada Market Share Analysis, By Distribution Channel, By Value, 2023-2030 (In %)
4.1.4.1.3. Mexico Market Share Analysis, By Distribution Channel, By Value, 2023-2030 (In %)
4.1.4.2. Europe Market Share Analysis, By Distribution Channel, By Value, 2023-2030 (In %)
4.1.4.2.1. UK Market Share Analysis, By Distribution Channel, By Value, 2023-2030 (In %)
4.1.4.2.2. France Market Share Analysis, By Distribution Channel, By Value, 2023-2030 (In %)
4.1.4.2.3. Germany Market Share Analysis, By Distribution Channel, By Value, 2023-2030 (In %)
4.1.4.2.4. Italy Market Share Analysis, By Distribution Channel, By Value, 2023-2030 (In %)
4.1.4.2.5. Spain Market Share Analysis, By Distribution Channel, By Value, 2023-2030 (In %)
4.1.4.2.6. Sweden Market Share Analysis, By Distribution Channel, By Value, 2023-2030 (In %)
4.1.4.2.7. Austria Market Share Analysis, By Distribution Channel, By Value, 2023-2030 (In %)
4.1.4.2.8. Rest of Europe Market Share Analysis, By Distribution Channel, By Value, 2023-2030 (In %)
4.1.4.3. Asia Pacific Market Share Analysis, By Distribution Channel, By Value, 2023-2030 (In %)
4.1.4.3.1. China Market Share Analysis, By Distribution Channel, By Value, 2023-2030 (In %)
4.1.4.3.2. India Market Share Analysis, By Distribution Channel, By Value, 2023-2030 (In %)
4.1.4.3.3. Japan Market Share Analysis, By Distribution Channel, By Value, 2023-2030 (In %)
4.1.4.3.4. South Korea Market Share Analysis, By Distribution Channel, By Value, 2023-2030 (In %)
4.1.4.3.5. Australia Market Share Analysis, By Distribution Channel, By Value, 2023-2030 (In %)
4.1.4.3.6. ASEAN Market Share Analysis, By Distribution Channel, By Value, 2023-2030 (In %)
4.1.4.3.7. Rest of APAC Market Share Analysis, By Distribution Channel, By Value, 2023-2030 (In %)
4.1.4.4. South America Market Share Analysis, By Distribution Channel, By Value, 2023-2030 (In %)
4.1.4.4.1. Brazil Market Share Analysis, By Distribution Channel, By Value, 2023-2030 (In %)
4.1.4.4.2. Argentina Market Share Analysis, By Distribution Channel, By Value, 2023-2030 (In %)
4.1.4.4.3. Rest of South America Market Share Analysis, By Distribution Channel, By Value, 2023-2030 (In %)
4.1.4.5. Middle East and Africa Market Share Analysis, By Distribution Channel, By Value, 2023-2030 (In %)
4.1.4.5.1. South Africa Market Share Analysis, By Distribution Channel, By Value, 2023-2030 (In %)
4.1.4.5.2. GCC Market Share Analysis, By Distribution Channel, By Value, 2023-2030 (In %)
4.1.4.5.3. Egypt Market Share Analysis, By Distribution Channel, By Value, 2023-2030 (In %)
4.1.4.5.4. Nigeria Market Share Analysis, By Distribution Channel, By Value, 2023-2030 (In %)
4.1.4.5.5. Rest of Middle East and Africa Market Share Analysis, By Distribution Channel, By Value, 2023-2030 (In %)
4.2. Stellar Competition matrix
4.2.1. Global Stellar Competition Matrix
4.2.2. North America Stellar Competition Matrix
4.2.3. Europe Stellar Competition Matrix
4.2.4. Asia Pacific Stellar Competition Matrix
4.2.5. South America Stellar Competition Matrix
4.2.6. Middle East and Africa Stellar Competition Matrix
4.3. Key Players Benchmarking
4.3.1. Key Players Benchmarking by Product, Pricing, Market Share, Investments, Expansion Plans, Physical Presence and Presence in the Market.
4.4. Mergers and Acquisitions in Industry
4.4.1. M&A by Region, Value and Strategic Intent
4.5. Market Dynamics
4.5.1. Market Drivers
4.5.2. Market Restraints
4.5.3. Market Opportunities
4.5.4. Market Challenges
4.5.5. PESTLE Analysis
4.5.6. PORTERS Five Force Analysis
4.5.7. Value Chain Analysis
Chapter 5 Global White Goods Market Segmentation: By Product
5.1. Global White Goods Market, By Product, Overview/Analysis, 2023-2030
5.2. Global White Goods Market, By Product, By Value, Market Share (%), 2023-2030 (USD Billion)
5.3. Global White Goods Market, By Product, By Value,
5.3.1. Air Conditioner
5.3.2. Refrigerator
5.3.3. Washing Machine
5.3.4. Microwave Oven
5.3.5. Others
Chapter 6 Global White Goods Market Segmentation: By Distribution Channel
6.1. Global White Goods Market, By Distribution Channel, Overview/Analysis, 2023-2030
6.2. Global White Goods Market Size, By Distribution Channel, By Value, Market Share (%), 2023-2030 (USD Billion)
6.3. Global White Goods Market, By Distribution Channel, By Value,
6.3.1. Hypermarket and Supermarket
6.3.2. Specialty Stores
6.3.3. E-Commerce
6.3.4. Others
Chapter 7 Global White Goods Market Segmentation: By Region
7.1. Global White Goods Market, By Region – North America
7.1.1. North America White Goods Market Size, By Product, By Value, 2023-2030 (USD Billion)
7.1.2. North America White Goods Market Size, By Distribution Channel, By Value, 2023-2030 (USD Billion) 7.1.3. By Country – U.S.
7.1.3.1. U.S. White Goods Market Size, By Product, By Value, 2023-2030 (USD Billion)
7.1.3.2. U.S. White Goods Market Size, By Distribution Channel, By Value, 2023-2030 (USD Billion)
7.1.3.3. Canada White Goods Market Size, By Value, 2023-2030 (USD Billion)
7.1.3.4. Mexico White Goods Market Size, By Value, 2023-2030 (USD Billion)
7.2. Europe White Goods Market Size, By Value, 2023-2030 (USD Billion)
7.2.1. UK
7.2.2. France
7.2.3. Germany
7.2.4. Italy
7.2.5. Spain
7.2.6. Sweden
7.2.7. Austria
7.2.8. Rest of Europe
7.3. Asia Pacific White Goods Market Size, By Value, 2023-2030 (USD Billion)
7.3.1. China
7.3.2. India
7.3.3. Japan
7.3.4. South Korea
7.3.5. Australia
7.3.6. ASEAN
7.3.7. Rest of APAC
7.4. Middle East and Africa White Goods Market Size, By Value, 2023-2030 (USD Billion)
7.4.1. South Africa
7.4.2. GCC
7.4.3. Egypt
7.4.4. Nigeria
7.4.5. Rest of Middle East and Africa
7.5. South America White Goods Market Size, By Value, 2023-2030 (USD Billion)
7.5.1. Brazil
7.5.2. Argentina
7.5.3. Rest of South America
Chapter 8 Company Profiles
8.1. Key Players
8.1.1. Whirlpool Corporation
8.1.1.1. Company Overview
8.1.1.2. Product Portfolio
8.1.1.3. Financial Overview
8.1.1.4. Business Strategy
8.1.1.5. Key Developments
8.1.2. Panasonic Corporation
8.1.3. IFB Industries
8.1.4. Samsung
8.1.5. Sharp Corporation
8.1.6. LG Electronics
8.1.7. Hitachi, Ltd
8.1.8. Robert Bosch GMBH
8.1.9. Symphony Limited
8.1.10. Blue Star Limited
8.1.11. Godrej & Boyce Mfg. Co. Ltd.
8.1.12. AB Electrolux
8.1.13. Haier Inc.
8.1.14. Midea Group
8.1.15. Siemens
8.1.16. TCL Corporation
8.1.17. Mitsubishi Electric Corporation
8.1.18. Johnson Controls
8.2. Key Findings
8.3. Recommendations


