Digital Agriculture Market Industry Analysis and Forecast 2032
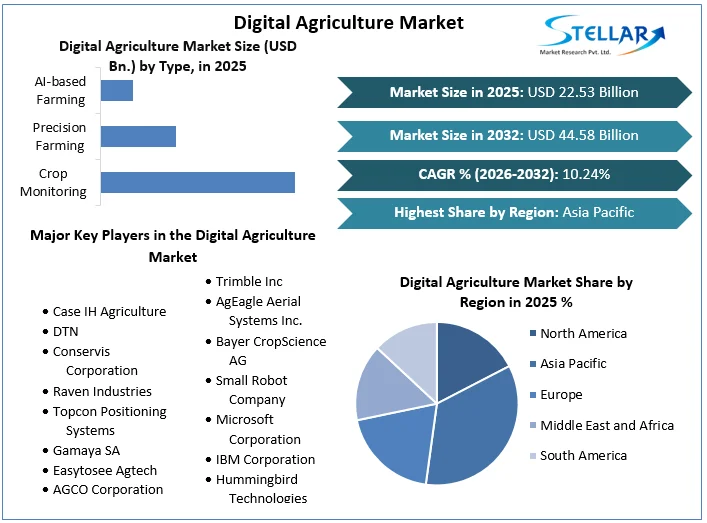
Digital Agriculture Market size was valued at US$ 22.53 Bn. in 2025 and the total Digital Agriculture revenue is expected to grow at 10.24% from 2026 to 2032, reaching nearly US$ 44.58 Bn.
Digital Agriculture Market Overview:
The agricultural and food sector is confronted with a slew of issues. With a predicted worldwide population of nearly 9.5 billion people by 2050, there will be a considerable rise in food consumption. At the same time, natural resources such as fresh water and fertile land are becoming scarcer. Production isn't the only issue; even though agricultural output is presently sufficient to feed the world, over 600 million people are victims of hunger. The rising rate of urbanization, for example, has significant ramifications for food demand and supply patterns. The agriculture industry continues to be vital to people's livelihoods and jobs. There are over 560 million smaller farms in the world, and agriculture and food production employ 26.7% of the global workforce. The global report on the digital agriculture market is studied and analysed on the basis of the segments by type, application, management and region.
Digital technology’s emergence, accessibility, and flexibility are revolutionizing agricultural and food production. Cellphone technologies, remote sensing, and cloud services are already enhancing smallholders' access to data, inputs, and markets, improving productivity, simplifying supply chains, and lowering operational expenses in the agricultural and food industry. However, there are several obstacles to overcome in the 'digitalization' of agriculture and the food value chain. Cybersecurity and data protection, labor replacement and re-education, and the possibility of establishing a digital gap across economies, sectors, or individuals with varying ability to accept new technology are all issues that need to be addressed. Regardless of these considerations, digital change in agriculture is unquestionably here to stay.
To get more Insights: Request Free Sample Report
Digital Agriculture Market Dynamics:
Government policies and programs for the endorsement of digital agriculture are one of the key drivers of the digital agriculture market.
Government regulations and guidelines are one of the main causes growth of digital agriculture market in many regions. These factors contribute to the creation of a favorable environment for competitive digital marketplaces and electronic services. There is also a tendency toward governments implementing e-services referred to as e-government particularly in the areas of health, education, the climate, and work. Designing and administering a digital government program, on the other hand, necessitates a high degree of administrative competence, and some nations have had mixed results. Developing countries frequently have the smallest capacity to handle the process. Success varies by sector, and in many nations, the agricultural industry falls behind, despite being key employment in rural regions.
A key restraint of the market is the lack of technical expertise for the effective implementation of digital agriculture technologies.
IT-based farm management systems detect, evaluate, and regulate field variability by executing crop production strategies at the optimum place, time, and manner to achieve optimal profitability, sustainability, and protection of land resources. Despite substantial research, only a tiny number of farmers have implemented any precision agriculture technological system approach to reorganize the entire agricultural economy toward reduced input, elevated efficiency, and sustainable farming.

A major challenge in the global market is connecting and convincing marginalized and remote communities to implement digital systems in their farming methods.
Digital agricultural and food systems require a well-developed digital infrastructure, particularly in rural regions, so it will the main challenge for digital agriculture market growth. Even though technological advancements and legislative changes have enhanced access to computers and IT for individuals all over the world, there is still a digital divide. Just as one technology becomes accessible to people of all economic levels, another emerges, leaving users in developing nations to catch up with the rest of the world.
Digital Agriculture Market Segment Analysis:
By Type, the precision farming segment held the largest share of over 45% in the digital agriculture market in 2025. This segment is projected to grow at a CAGR of 13.6% in the forecast period. After the COVID-19 pandemic, the precision farming segment is expected to grow in the long run, as precision farming allows farmers to supervise the state of their crops while not being physically present in the field through the use of automation, reducing the need to contact other people, which is critical during these times. When opposed to traditional gardening practices, this farming is a strategy in which inputs are used in exact proportions to boost average yields.
These approaches save time and money by lowering fertilizer and pesticide treatment costs, as well as reducing pollution by reducing compound use. They also aid in the surveillance of soil and plants’ physical and chemical scenarios, i.e. electrical conductivity, temperature, evaporation and transpiration, radiation, and moisture, by placing sensors to measure parameters such as electrical properties, nitrates, temperature radiation, and leaves and soil moisture, so that the optimal situations for plant growth can be maintained. These elements help to achieve higher production with a restricted labor force during a pandemic situation where there is a labor shortage, guaranteeing a consistent supply of food and thereby assuring food security.
Predictive farming is similar to taking a medication to treat a certain condition. From the type of crop suited for a plot to the usage of pesticides in certain areas, the solutions are highly personalized. Precision farming minimizes production costs and waste by catering to the specific demands of each plot. Precision farming is accomplished via the use of analytical software and technical equipment. Soil testing, plot measuring, weather pattern analysis, and crop analysis are all done with precision using sensor-equipped devices positioned throughout the fields. The data is calibrated to conclude, and a highly specific and accurate set of practices may be implemented based on the findings.
Digital Agriculture Market Regional Insights:
North America:
The US Global Development Lab and the Bureau for Food Security partnered on Digital Development for Feed the Future program to show how using digital tools cohesively and according to guidelines can maximize cost-effectiveness and growth outcomes of the US Government's Feed the Future Initiative (D2FTF). Feed the Future's Digital Development team is expanding the use of these technologies through a variety of means, including technical help to Feed the Future programs, capacity development for Feed the Future teams, and enhancing the knowledge base on best practices. Based on proof of their effect, Feed the Future's digital development is centered on four areas of digital tools: precision farming, financial technology services, info-driven farming, and ICT-equipped extensions.
Asia Pacific:
Southeast Asia has around 71 million smallholder farmers. These households, in many cases, are among the poorest in the region, and they frequently struggle to produce enough to make a living or even feed their own family. Their primary farming challenges include; Limited market access, small-sized farms, higher labor costs, and their vulnerability to varying weather patterns. According to a recent industry association survey, India has over 440 agritech firms, which grew by 23.5% year over year from 2018 to 2019. As an early mover in the development and expansion of these solutions, India is home to some of the most well-established digital advising firms. SourceTrace and CropIn, for example, are two of the most well-known traceability technologies. Farm digitization, supply chain technology, and financial services for farmers have all lately attracted the attention of generalist venture capitalist funds.
The purpose of this research is to provide stakeholders in the industry with a thorough insight into the Digital Agriculture market. The study includes an analysis of difficult data in simple language, as well as the industry's historical and current state, as well as anticipated market size and trends. The market report examines all segments of the industry, with a focus on significant players such as market leaders, followers, and new entrants.
The report includes a PORTER, PESTEL analysis as well as the possible influence of microeconomic market determinants. External and internal elements that are expected to have a favorable or negative impact on the firm have been examined, providing decision-makers with a clear future vision of the industry. The research also aids in comprehending the Digital Agriculture market dynamics and structure by studying market segments and forecasting market size. The research is an investor's guide since it depicts the competitive analysis of major competitors in the Digital Agriculture market by product, price, financial situation, product portfolio, growth plans, and geographical presence.
Breakthroughs in the Digital Agriculture industry are discussed, as well as organic and inorganic growth plans. Various companies are focusing on organic growth strategies such as new product releases, product approvals, and other items such as patents and events. Inorganic growth strategies used in the industry included acquisitions, partnerships, and collaborations.
Digital Agriculture Market Scope:
|
Digital Agriculture Market |
|
|
Market Size in 2025 |
USD 22.53 Bn. |
|
Market Size in 2032 |
USD 44.58 Bn. |
|
CAGR (2026-2032) |
10.24% |
|
Historic Data |
2020-2025 |
|
Base Year |
2025 |
|
Forecast Period |
2026-2032 |
|
Segment Scope |
by Type
|
|
by Application
|
|
|
by Management
|
|
|
Regional Scope |
North America- United States, Canada, and Mexico Europe – UK, France, Germany, Italy, Spain, Sweden, Austria, and Rest of Europe Asia Pacific – China, India, Japan, South Korea, Australia, ASEAN, Rest of APAC Middle East and Africa - South Africa, GCC, Egypt, Nigeria, Rest of the Middle East and Africa South America – Brazil, Argentina, Rest of South America |
Digital Agriculture Market Players:
- Case IH Agriculture
- DTN
- Conservis Corporation
- Raven Industries
- Topcon Positioning Systems
- Gamaya SA
- Easytosee Agtech
- AGCO Corporation
- Trimble Inc
- AgEagle Aerial Systems Inc.
- Bayer CropScience AG
- Small Robot Company
- Microsoft Corporation
- IBM Corporation
- Hummingbird Technologies Limited
- Deere & Company
Frequently Asked Questions
AI and government policies are the drivers of the Digital Agriculture market.
Government policies and programs for the endorsement of digital agriculture are one of the key drivers of the digital agriculture market.
Digital Agriculture Market size was valued at US$ 22.53 Bn. in 2025 and the total Digital Agriculture revenue is expected to grow at 10.24% through 2026 to 2032, reaching nearly US$ 44.58 Bn.
The segments covered are Type, Application, Management and, Region.
1. Digital Agriculture Market: Research Methodology
1.1. Research Data
1.1.1. Secondary Data
1.1.2. Primary Data
1.2. Market Size Estimation
1.2.1. Bottom-Up Approach
1.2.2. Top-Up Approach
1.3. Market Breakdown and Data Triangulation
1.4. Research Assumption
2. Digital Agriculture Market: Executive Summary
3. Digital Agriculture Market: Competitive Landscape
3.1. Stellar Competition Matrix
3.2. Key Players Benchmarking
3.3. Market Structure
3.3.1. Market Leaders
3.3.2. Market Followers
3.3.3. Emerging Players
3.3.4. Revenue Analysis
3.4. Consolidation of the Market
4. Digital Agriculture Market: Dynamics
4.1. Market Trends
4.2. Market Driver
4.3. Market Restraints
4.4. Market Opportunities
4.5. Market Challenges
4.6. Technology Roadmap
4.7. PESTLE Analysis
4.8. PORTER’s Five Forces Analysis
4.9. Regulatory Landscape by Region
4.9.1. North America
4.9.2. Europe
4.9.3. Asia Pacific
4.9.4. Middle East and Africa
4.9.5. South America
5. Digital Agriculture Market Size and Forecast by Segments (by Value in USD Mn)
5.1. Digital Agriculture Market Size and Forecast, by Type (2025-2032)
5.1.1. Crop Monitoring
5.1.2. Precision Farming
5.1.3. AI-based Farming
5.2. Digital Agriculture Market Size and Forecast, By Application (2025-2032)
5.2.1. Field Mapping
5.2.2. Soil Monitoring
5.2.3. Crop Scouting
5.2.4. Yield Monitoring
5.2.5. Variable Rate Application
5.2.6. Other
5.3. Digital Agriculture Market Size and Forecast, By Management (2025-2032)
5.3.1. Crop Management
5.3.2. Financial Management
5.3.3. Farm Inventory Management
5.3.4. Personnel Management
5.3.5. Weather Tracking & Forecasting
5.4. Digital Agriculture Market Size and Forecast, by Region (2025-2032)
5.4.1. North America
5.4.2. Europe
5.4.3. Asia Pacific
5.4.4. Middle East and Africa
5.4.5. South America
6. North America Digital Agriculture Market Size and Forecast (by Value in USD Mn)
6.1. North America Digital Agriculture Market Size and Forecast, by Type (2025-2032)
6.1.1. Crop Monitoring
6.1.2. Precision Farming
6.1.3. AI-based Farming
6.2. North America Digital Agriculture Market Size and Forecast, By Application (2025-2032)
6.2.1. Field Mapping
6.2.2. Soil Monitoring
6.2.3. Crop Scouting
6.2.4. Yield Monitoring
6.2.5. Variable Rate Application
6.2.6. Other
6.3. North America Digital Agriculture Market Size and Forecast, By Management (2025-2032)
6.3.1. Crop Management
6.3.2. Financial Management
6.3.3. Farm Inventory Management
6.3.4. Personnel Management
6.3.5. Weather Tracking & Forecasting
6.4. North America Digital Agriculture Market Size and Forecast, by Country (2025-2032)
6.4.1. United States
6.4.2. Canada
6.4.3. Mexico
7. Europe Digital Agriculture Market Size and Forecast (by Value in USD Mn)
7.1. Europe Digital Agriculture Market Size and Forecast, by Type (2025-2032)
7.2. Europe Digital Agriculture Market Size and Forecast, By Application (2025-2032)
7.3. Europe Digital Agriculture Market Size and Forecast, By Management (2025-2032)
7.4. Europe Digital Agriculture Market Size and Forecast, by Country (2025-2032)
7.4.1. UK
7.4.2. France
7.4.3. Germany
7.4.4. Italy
7.4.5. Spain
7.4.6. Sweden
7.4.7. Austria
7.4.8. Rest of Europe
8. Asia Pacific Digital Agriculture Market Size and Forecast (by Value in USD Mn)
8.1. Asia Pacific Digital Agriculture Market Size and Forecast, by Type (2025-2032)
8.2. Asia Pacific Digital Agriculture Market Size and Forecast, By Application (2025-2032)
8.3. Asia Pacific Digital Agriculture Market Size and Forecast, By Management (2025-2032)
8.4. Asia Pacific Digital Agriculture Market Size and Forecast, by Country (2025-2032)
8.4.1. China
8.4.2. S Korea
8.4.3. Japan
8.4.4. India
8.4.5. Australia
8.4.6. Indonesia
8.4.7. Malaysia
8.4.8. Vietnam
8.4.9. Taiwan
8.4.10. Bangladesh
8.4.11. Pakistan
8.4.12. Rest of Asia Pacific
9. Middle East and Africa Digital Agriculture Market Size and Forecast (by Value in USD Mn)
9.1. Middle East and Africa Digital Agriculture Market Size and Forecast, by Type (2025-2032)
9.2. Middle East and Africa Digital Agriculture Market Size and Forecast, By Application (2025-2032)
9.3. Middle East and Africa Digital Agriculture Market Size and Forecast, By Management (2025-2032)
9.4. Middle East and Africa Single-Use Filtration Assembly Market Size and Forecast, by Country (2025-2032)
9.4.1. South Africa
9.4.2. GCC
9.4.3. Egypt
9.4.4. Nigeria
9.4.5. Rest of ME&A
10. South America Digital Agriculture Market Size and Forecast (by Value in USD Mn)
10.1. South America Digital Agriculture Market Size and Forecast, by Type (2025-2032)
10.2. South America Digital Agriculture Market Size and Forecast, By Application (2025-2032)
10.3. South America Digital Agriculture Market Size and Forecast, By Management (2025-2032)
10.4. South America Digital Agriculture Market Size and Forecast, by Country (2025-2032)
10.4.1. Brazil
10.4.2. Argentina
10.4.3. Rest of South America
11. Company Profiles: Key Players
11.1. Case IH Agriculture
11.1.1. Company Overview
11.1.2. Source Portfolio
11.1.3. Financial Overview
11.1.4. Business Strategy
11.1.5. Recent Developments
11.2. DTN
11.3. Conservis Corporation
11.4. Raven Industries
11.5. Topcon Positioning Systems
11.6. Gamaya SA
11.7. Easytosee Agtech
11.8. AGCO Corporation
11.9. Trimble Inc
11.10. AgEagle Aerial Systems Inc.
11.11. Bayer CropScience AG
11.12. Small Robot Company
11.13. Microsoft Corporation
11.14. IBM Corporation
11.15. Hummingbird Technologies Limited
11.16. Deere & Company
12. Key Findings
13. Analyst Recommendations