CubeSat Market Industry Analysis and Forecast (2025-2032)
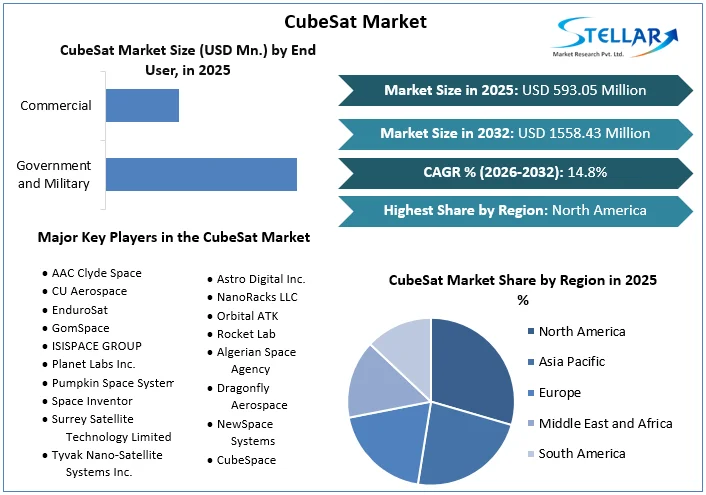
CubeSat Market size was valued at USD 593.05 Mn. in 2025 and the CubeSat revenue is expected to grow at a CAGR of 14.8% from 2026 to 2032, reaching nearly USD 1558.43 Mn. by 2032.
CubeSat Market Overview:
A CubeSat is a class of small satellite with a form factor of 10 cm (3.9 in) cubes. CubeSats have a mass of no more than 2 kg (4.4 lb.) per unit, and often use commercial off-the-shelf (COTS) components for their electronics and structure. CubeSats are deployed into orbit from the International Space Station, or launched as secondary payloads on a launch vehicle. As of December 2023, more than 2,300 CubeSats have been launched. Because of their small size and lightness, CubeSats are an excellent choice for exploring future ideas and devices since they can be assembled and tested rapidly for suitability.
The same aspects allow CubeSats to be produced relatively fast. CubeSats are very small satellites compared with traditional ones, and are fabricated, tested and launched at ease. As more players enter the market and innovation continues, the CubeSat sector is poised for continued growth, fostering new opportunities for both established aerospace companies and emerging startups.
The CubeSat market provides market size, share, scope, growth, and potential of the industry. It offers valuable in application to help businesses identify opportunities and potential risks within the market. Also the global CubeSat market research reports provide detailed analysis of market conditions, trends, challenges, and recommendations for stakeholders in the industry.
To get more Insights: Request Free Sample Report
CubeSat Market Dynamics:
CubeSat Revolution Driving Global Market Growth through Innovation and Cost Efficiency
One of the key factors driving the global market is the rapidly increasing use of CubeSats for activities linked with earth observation, communication, science and technology. Moreover, significant investments have been made in CubeSat by regulatory bodies and private firms to quickly fabricate, evaluate and experiment on new technologies and developments in satellite technology. Usually, CubeSat missions are carried out on a very tight budget. Sections Non-space components are frequently accepted and used in CubeSat missions. This makes it possible to employ the newest commercial and industrial grade components and execute solutions at a reduced cost and in a shorter amount of time.
The cheaper cost of CubeSats compared to regular satellites is another important advantage. CubeSats are typically much cheaper to create compared to customary satellites whose usual creation cost range stands at between $5,000 and $50,000 dollars per one cube satellite (CubeSat). In comparison, ten GPS satellites cost the USAF approximately five hundred seventy-seven million dollars in 2018, translated to roughly fifty eight million dollars for each.
Challenges Facing the CubeSat Market
Addressing Challenges in Size, Technology, and Lifespan
There are certain challenges for CubeSats over conventional satellites. The main challenge of CubeSats is their simplicity. One of the main architectural limitations facing CubeSat developers is space. A CubeSat's limited size significantly restricts the kinds of technologies that can be installed on board. Propulsion systems, for instance, are rather common in regular satellites but incredibly uncommon in CubeSats. Because of this, the reach of CubeSat missions constrained in comparison to the capabilities of other conventional satellites. The short operating time of CubeSats is another drawback.
Most CubeSats only have a one- to five-year operational lifespan. On the other hand, the majority of conventional satellites are designed to last for a minimum of 5 to 15 years, and they continue to work for up to 25 years after the fact. It is challenging to carry out missions that call for a satellite to be active for extended periods of time due to the short lifespan of a CubeSat.
CubeSat Market Segment Analysis:
By Size, The CubeSat market section analysis by means of size well-known shows a diverse landscape shaped with the aid of various challenge requirements and technological capabilities. Nano and Pico CubeSats, generally starting from 1U to 3U, dominate the market because of their value-effectiveness and suitability for a huge range of packages that include generation demonstration, academic functions, and scientific studies. These smaller CubeSats provide agility and versatility, making them famous among universities, startups, and emerging space players.
However, as venture requirements develop more complex, large CubeSats, inclusive of 6U and 12U configurations, are gaining traction, specifically in missions requiring higher payload ability and superior instrumentation like excessive-decision imaging and telecommunications. In spite of their better fee and complexity, those large CubeSats cater to the evolving wishes of industrial, governmental, and military applications, increasing the market's scope and using innovation in CubeSat generation.
CubeSat Market Regional Insight:
In 2025, North America has the highest revenue share because it has more commercial CubeSat launches and have leading companies that made the decision to launch their goods. The geographical segmentation of CubeSat market includes North America, Europe, Asia Pacific, Middle East & Africa, South and Central America. The growth of Europe has increased use of satellites for environmental monitoring and the rise in demand for small satellites. In Asia Pacific, significant growth is expected in the forecast duration.
CubeSat Market Competitive Landscape:
- In April 2023, the European Space Agency (ESA) announced that it is planning to launch a constellation of 30 CubeSats to study the Sun. The satellites will be launched in 2025 as part of ESA's Solar Orbiter mission.
- In March 2023, NASA announced that it is planning to launch a constellation of 12 CubeSats to study the Moon. The satellites will be launched in 2024 as part of NASA's Artemis program.
CubeSat Market Scope:
|
CubeSat Market |
|
|
Market Size in 2025 |
USD 593.05 Mn. |
|
Market Size in 2032 |
USD 1558.43 Mn. |
|
CAGR (2026-2032) |
14.8 % |
|
Historic Data |
2020-2025 |
|
Base Year |
2025 |
|
Forecast Period |
2026-2032 |
|
Segments |
By Size 0.25U to 1U 1 to 3U 3U to 12U 6U to 12U 12U and Above |
|
By Application Earth Observation and Traffic Monitoring Science Technology and Education Space Observation Others |
|
|
By End User Government and Military Commercial Others |
|
|
Regional Scope |
North America- United States, Canada, and Mexico Europe – UK, France, Germany, Italy, Spain, Sweden, Russia, and Rest of Europe Asia Pacific – China, India, Japan, South Korea, Australia, ASEAN, Rest of APAC Middle East and Africa - South Africa, GCC, Egypt, Rest of the Middle East and Africa South America – Brazil, Argentina, Rest of South America |
CubeSat Market Key Players:
- AAC Clyde Space
- CU Aerospace
- EnduroSat
- GomSpace
- ISISPACE GROUP
- Planet Labs Inc.
- Pumpkin Space Systems
- Space Inventor
- Surrey Satellite Technology Limited
- Tyvak Nano-Satellite Systems Inc.
- Astro Digital Inc.
- NanoRacks LLC
- Orbital ATK
- Rocket Lab
- Algerian Space Agency
- Dragonfly Aerospace
- NewSpace Systems
- CubeSpace
- Sierra Nevada Corporation
- SITAEL
Frequently Asked Questions
Size, Technology, and Lifespan are the major challenges for CubeSat market.
The Market size was valued at USD 593.05 Million in 2025 and the total Market revenue is expected to grow at a CAGR of 14.8 % from 2026 to 2032, reaching nearly USD 1558.43 Million.
The segments covered in the market report are by Size, by application and by End user.
1. CubeSat Market: Research Methodology
1.1. Research Data
1.1.1. Primary Data
1.1.2. Secondary Data
1.2. Market Size Estimation
1.2.1. Bottom-Up Approach
1.2.2. Top-Down Approach
1.3. Market Breakdown and Data Triangulation
1.4. Assumptions
2. CubeSat Market: Executive Summary
2.1. Market Overview
2.2. Market Size (2025) and Forecast (2026 – 2032) and Y-O-Y%
2.3. Market Size (USD) and Market Share (%) – By Segments and Regions
3. CubeSat Market: Competitive Landscape
3.1. Stellar Competition Matrix
3.2. Key Players Benchmarking
3.2.1. Company Name
3.2.2. Headquarter
3.2.3. Product Segment
3.2.4. End-user Segment
3.2.5. Y-O-Y%
3.2.6. Revenue (2025)
3.2.7. Profit Margin
3.2.8. Market Share
3.2.9. Company Locations
3.3. Market Structure
3.3.1. Market Leaders
3.3.2. Market Followers
3.3.3. Emerging Players
3.4. Consolidation of the Market
3.4.1. Strategic Initiatives and Developments
3.4.2. Mergers and Acquisitions
3.4.3. Collaborations and Partnerships
3.4.4. Product Launches and Innovation
4. CubeSat Market: Dynamics
4.1. Market Trends by Region
4.1.1. North America
4.1.2. Europe
4.1.3. Asia Pacific
4.1.4. Middle East and Africa
4.1.5. South America
4.2. Market Drivers
4.3. Market Restraints
4.4. Market Opportunities
4.5. Market Challenges
4.6. PORTER’s Five Forces Analysis
4.6.1. Intensity of the Rivalry
4.6.2. Threat of New Entrants
4.6.3. Bargaining Power of Suppliers
4.6.4. Bargaining Power of Buyers
4.6.5. Threat of Substitutes
4.7. PESTLE Analysis
4.7.1. Political Factors
4.7.2. Economic Factors
4.7.3. Social Factors
4.7.4. Technological Factors
4.7.5. Legal Factors
4.7.6. Environmental Factors
4.8. Technological Roadmap
4.9. Value Chain Analysis
4.10. Regulatory Landscape by Region
4.10.1. North America
4.10.2. Europe
4.10.3. Asia Pacific
4.10.4. Middle East and Africa
4.10.5. South America
5. CubeSat Market Size and Forecast by Segments (by Value USD Million)
5.1. CubeSat Market Size and Forecast, By Size (2025-2032)
5.1.1. 0.25U to 1U
5.1.2. 1 to 3U
5.1.3. 3U to 12U
5.1.4. 6U to 12U
5.1.5. 12U and Above
5.2. CubeSat Market Size and Forecast, By Application (2025-2032)
5.2.1. Earth Observation and Traffic Monitoring
5.2.2. Science Technology and Education
5.2.3. Space Observation
5.2.4. Others
5.3. CubeSat Market Size and Forecast, By End User (2025-2032)
5.3.1. Government and Military
5.3.2. Commercial
5.3.3. Others
5.4. CubeSat Market Size and Forecast, by Region (2025-2032)
5.4.1. North America
5.4.2. Europe
5.4.3. Asia Pacific
5.4.4. Middle East and Africa
5.4.5. South America
6. North America CubeSat Market Size and Forecast (by Value USD Million)
6.1. North America CubeSat Market Size and Forecast, By Size (2025-2032)
6.1.1. 0.25U to 1U
6.1.2. 1 to 3U
6.1.3. 3U to 12U
6.1.4. 6U to 12U
6.1.5. 12U and Above
6.2. North America CubeSat Market Size and Forecast, By Application (2025-2032)
6.2.1. Earth Observation and Traffic Monitoring
6.2.2. Science Technology and Education
6.2.3. Space Observation
6.2.4. Others
6.3. North America CubeSat Market Size and Forecast, By End User (2025-2032)
6.3.1. Government and Military
6.3.2. Commercial
6.3.3. Others
6.4. North America CubeSat Market Size and Forecast, by Country (2025-2032)
6.4.1. United States
6.4.2. Canada
6.4.3. Mexico
7. Europe CubeSat Market Size and Forecast (by Value USD Million)
7.1. Europe CubeSat Market Size and Forecast, By Size (2025-2032)
7.2. Europe CubeSat Market Size and Forecast, By Application (2025-2032)
7.3. Europe CubeSat Market Size and Forecast, By End User (2025-2032)
7.4. Europe CubeSat Market Size and Forecast, by Country (2025-2032)
7.4.1. UK
7.4.2. France
7.4.3. Germany
7.4.4. Italy
7.4.5. Spain
7.4.6. Sweden
7.4.7. Austria
7.4.8. Rest of Europe
8. Asia Pacific CubeSat Market Size and Forecast (by Value USD Million)
8.1. Asia Pacific CubeSat Market Size and Forecast, By Size (2025-2032)
8.2. Asia Pacific CubeSat Market Size and Forecast, By Application (2025-2032)
8.3. Asia Pacific CubeSat Market Size and Forecast, By End User (2025-2032)
8.4. Asia Pacific CubeSat Market Size and Forecast, by Country (2025-2032)
8.4.1. China
8.4.2. S Korea
8.4.3. Japan
8.4.4. India
8.4.5. Australia
8.4.6. Indonesia
8.4.7. Malaysia
8.4.8. Vietnam
8.4.9. Taiwan
8.4.10. Bangladesh
8.4.11. Pakistan
8.4.12. Rest of Asia Pacific
9. Middle East and Africa CubeSat Market Size and Forecast (by Value USD Million)
9.1. Middle East and Africa CubeSat Market Size and Forecast, By Size (2025-2032)
9.2. Middle East and Africa CubeSat Market Size and Forecast, By Application (2025-2032)
9.3. Middle East and Africa CubeSat Market Size and Forecast, By End User (2025-2032)
9.4. Middle East and Africa CubeSat Market Size and Forecast, by Country (2025-2032)
9.4.1. South Africa
9.4.2. GCC
9.4.3. Egypt
9.4.4. Nigeria
9.4.5. Rest of ME&A
10. South America CubeSat Market Size and Forecast (by Value USD Million)
10.1. South America CubeSat Market Size and Forecast, By Size (2025-2032)
10.2. South America CubeSat Market Size and Forecast, By Application (2025-2032)
10.3. South America CubeSat Market Size and Forecast, By End User (2025-2032)
10.4. South America CubeSat Market Size and Forecast, by Country (2025-2032)
10.4.1. Brazil
10.4.2. Argentina
10.4.3. Rest of South America
11. Company Profile: Key players
11.1. AAC Clyde Space
11.1.1. Company Overview
11.1.2. Product Portfolio
11.1.2.1. Product Name
11.1.2.2. Product Details (Price, Features, etc.)
11.1.3. Financial Overview
11.1.3.1. Total Revenue
11.1.3.2. Segment Revenue
11.1.3.3. Regional Revenue
11.1.4. SWOT Analysis
11.1.5. Strategic Analysis
11.1.6. Recent Developments
11.2. CU Aerospace
11.3. EnduroSat
11.4. GomSpace
11.5. ISISPACE GROUP
11.6. Planet Labs Inc.
11.7. Pumpkin Space Systems
11.8. Space Inventor
11.9. Surrey Satellite Technology Limited
11.10. Tyvak Nano-Satellite Systems Inc.
11.11. Astro Digital Inc.
11.12. NanoRacks LLC
11.13. Orbital ATK
11.14. Rocket Lab
11.15. Algerian Space Agency
11.16. Dragonfly Aerospace
11.17. NewSpace Systems
11.18. CubeSpace
11.19. Sierra Nevada Corporation
11.20. SITAEL
12. Key Findings
13. Industry Recommendations
13.1. Strategic Recommendations
13.2. Future Outlook