Global Corporate Travel Market 2026–2032 | Smart Booking, AI Travel Tech & Regional Growth
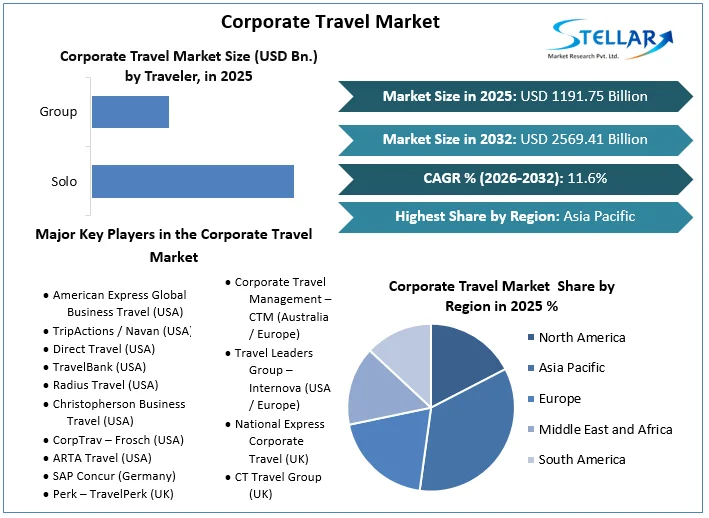
Corporate Travel Market is expected to grow from USD 1,191.75 Bn. in 2025 to USD 2569.41 Bn. by 2032, registering a strong CAGR of 11.6%. Market growth is being driven by rapid digitalization of travel management, increasing adoption of AI-powered booking platforms, rising demand for managed corporate travel services and growth of international business operations.
Corporate Travel Market Report Overview
Global Corporate Travel Market is entering a high-impact transformation phase, shifting from traditional booking ecosystems to intelligent, AI-driven mobility platforms. Valued at USD 1,191.75 billion in 2025 and expected to reach USD 2,569.42 billion by 2032, the corporate travel market is being reshaped by automation, managed travel adoption, sustainability compliance and premium corporate mobility demand. Enterprises are no longer buying travel services; they are investing in optimized travel ecosystems that improve cost control, risk governance, employee experience and ESG performance. With Asia-Pacific emerging as the volume engine and North America fueling value creation, corporate travel is evolving into a strategic business infrastructure rather than an operational expense.
Corporate Travel Market Key Highlights
- AI Adoption Accelerating at Enterprise Level
Over 66% of large enterprises are expected to integrate AI-driven booking, expense automation and pricing optimization tools into their travel programs by 2032.
- Cost Leakage Reduction of 25% Through Smart Travel Tech
Advanced travel management platforms are helping companies cut unmanaged spend and booking inefficiencies by up to 25%, directly improving travel ROI.
- Sustainability Driving Procurement Decisions
70% of corporations are projected to prioritize low-carbon travel options and ESG-compliant suppliers in their corporate travel contracts by 2028.
- Asia Pacific to Contribute Over 40% of New Demand
Rapid international business expansion and infrastructure investments are expected to make APAC the largest incremental growth contributor over the forecast period.
To get more Insights: Request Free Sample Report
Corporate Travel Market Dynamics:
AI-Powered Travel Management Platforms to Fuel Corporate Travel Market Growth
A major growth driver in the corporate travel market is the rapid shift toward AI-enabled booking, expense automation, and policy compliance platforms. 66% of large enterprises are expected to adopt AI-driven travel management systems by 2032, improving booking efficiency and reducing travel leakage by 25%.
Premium & Managed Travel Services to Create High Value Growth Opportunity
In Global Corporate Travel Market, managed travel programs, premium airline cabins and flexible booking services represent the strongest margin expansion opportunity. While managed travel accounted for 45% of total trips, it contributed 65% of total travel spend value in 2025, supported by higher service fees, compliance benefits and superior risk management capabilities.
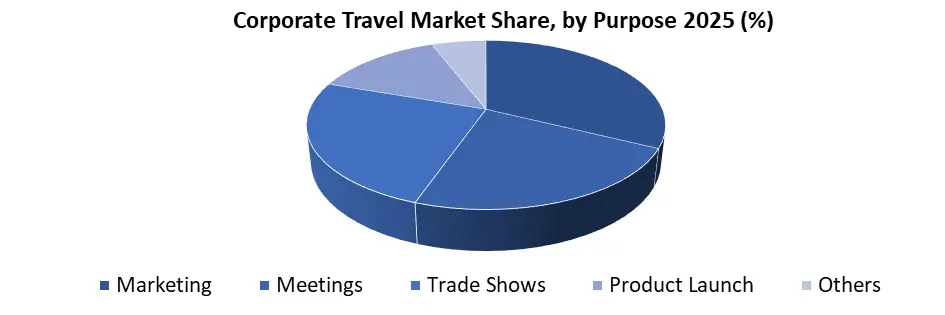
Corporate Travel Market Segment Analysis, by Purposes
Meeting’s purpose dominated the corporate travel market, accounting for XX% of total travel demand in 2025 driven by client negotiations, board discussions, project reviews and strategic partnerships. Their important role in business decision making positions meetings as the primary revenue-generating engine of market by 2032, especially for premium air travel and business class accommodation.
Trade Shows and Exhibitions represented the highest ROI segment in 2025, despite lower trip volumes. These events drive bulk travel bookings and premium hospitality demand, as a single exhibition are influence multi-million-dollar contracts, making this segment a key profitability driver for travel service providers.
Marketing-driven travel is gaining strategic importance as companies increase spending on brand activations, regional expansions and customer engagement programs, shifting the focus from volume-based trips to experience driven travel supported by premium venues and customized services. Product launch travel is emerging as a high-value segment, especially in technology, automotive and consumer electronics industries, where luxury accommodations, executive mobility and event focused logistics drive higher per-trip spending.
Corporate Travel Market Regional Analysis
Global corporate travel market dominated by Asia Pacific, generated over 40% of new demand in 2025, driven by multinational expansions, cross-border investments and booming technology and consulting hubs in China, India, Singapore and Southeast Asia. North America remained the highest-value market, contributing nearly 30% of spending in 2025, supported by AI-enabled travel platforms, premium cabins and managed travel programs. Europe held 25% share, emphasizing sustainability, compliance and digital travel integration. The Middle East and Africa emerged as a premium mobility gateway, while South America is expected to offer long term growth potential through rising FDI, trade expansion and cost-efficient corporate travel solutions.
Corporate Travel Market Competitive Landscape:
Global corporate travel market is dominated by multinational leaders such as American Express Global Business Travel, FCM Travel Solutions and SAP Concur, who are setting new benchmarks in innovation, digitalization and managed mobility solutions. A FCM Travel are expanding AI-enabled booking platforms, predictive analytics and subscription-based corporate travel programs. SAP Concur and Flight Centre focus on seamless expense management, risk mitigation and compliance automation. Regional and niche players differentiate through personalized travel concierge services, ESG-compliant travel solutions and cost-optimized mobility offerings, intensifying competition while unlocking value across enterprise, SME and government travel segments worldwide.
Investment & Strategy Focus Areas
|
Area |
Strategic Rationale |
|
AI-Enabled Booking Platforms |
Optimizes cost, reduces travel leakage by 25%, and enhances traveler experience. |
|
Managed Travel Programs |
Drives premium revenue, compliance, and risk management; improves ROI on corporate travel spend. |
|
Premium Air & Hotel Services |
High-value trips and executive mobility generate majority of revenue per trip. |
|
Sustainability & ESG Travel |
Meets corporate carbon targets, strengthens procurement compliance, and attracts ESG-conscious clients. |
|
Subscription-Based Travel Models |
Provides predictable revenue, simplifies billing and increases client retention. |
|
Global Corporate Travel Market Scope |
|
|
Market Size in 2025 |
USD 1191.75 Bn. |
|
Market Size in 2032 |
USD 2569.41 Bn. |
|
CAGR (2026-2032) |
11.6% |
|
Historic Data |
2020-2025 |
|
Base Year |
2025 |
|
Forecast Period |
2026-2032 |
|
Segments |
By Purpose Marketing Meetings Trade Shows Product Launch Others |
|
By Service Air Travel Accommodation Ground Transportation |
|
|
By Traveler Solo Group |
|
|
By End user Industry Finance and Banking Technology and IT Healthcare and Pharmaceuticals |
|
|
Regional Scope |
North America- US, Canada, and Mexico Europe – UK, France, Germany, Italy, Spain, Sweden, Russia, and Rest of Europe Asia Pacific – China, India, Japan, South Korea, Australia, ASEAN, Rest of APAC Middle East and Africa - South Africa, GCC, Egypt, Nigeria, Rest of the Middle East and Africa South America – Brazil, Argentina, Rest of South America |
Key players in Global Corporate Travel Market:
North America
- American Express Global Business Travel (USA)
- TripActions / Navan (USA)
- Direct Travel (USA)
- TravelBank (USA)
- Radius Travel (USA)
- Christopherson Business Travel (USA)
- CorpTrav – Frosch (USA)
- ARTA Travel (USA)
Europe
- SAP Concur (Germany)
- Perk – TravelPerk (UK)
- Booking.com for Business – Booking Holdings (Netherlands)
- Corporate Travel Management – CTM (Australia / Europe)
- Travel Leaders Group – Internova (USA / Europe)
- National Express Corporate Travel (UK)
- CT Travel Group (UK)
- Safe Harbors Business Travel (UK)
- Egencia Europe (France / UK operations)
Asia-Pacific
- FCM Travel Solutions (Australia)
- JTB Business Travel (Japan)
- GTI Travel (India)
- Corporate Travel Services (India)
- Yatra Corporate Travel (India)
- WegoPro (UAE / APAC)
- Tumodo (UAE / Middle East & Asia)
Frequently Asked Questions
The market size of The Corporate Travel Market in 2025 was valued $ 1,191.75 Billion.
Asia Pacific region held the highest share in 2025.
1. Global Corporate Travel Market Introduction
1.1. Study Assumption and Market Definition
1.2. Scope of the Study
1.3. Executive Summary
2. Global Corporate Travel Market: Competitive Landscape
2.1. Ecosystem Analysis
2.2. SMR Competition Matrix
2.3. Competitive Landscape
2.4. Key Players Benchmarking
2.4.1. Company Name
2.4.2. Business Segment
2.4.3. Distribution Channel Segment
2.4.4. Revenue (2025)
2.4.5. Company Locations
2.5. Market Structure
2.5.1. Market Leaders
2.5.2. Market Followers
2.5.3. Emerging Players
2.6. Mergers and Acquisitions Details
3. Global Corporate Travel Market: Dynamics
3.1. Global Corporate Travel Market Trends
3.2. Global Corporate Travel Market Dynamics
3.2.1. Drivers
3.2.2. Restraints
3.2.3. Opportunities
3.2.4. Challenges
3.3. PORTER’s Five Forces Analysis
3.4. PESTLE Analysis
3.5. Regulatory Landscape by region
3.6. Key Opinion Leader Analysis for the Global Industry
3.7. Analysis of Government Schemes and Initiatives for Industry
4. Global Corporate Travel Market: Global Market Size and Forecast by Segmentation (by Value in USD Billion) (2025-2032)
4.1. Global Corporate Travel Market Size and Forecast, By Purpose (2025-2032)
4.1.1. Marketing
4.1.2. Meetings (Stone Wool, Rock Wool)
4.1.3. Trade Shows
4.1.4. Product Launch
4.1.5. Others
4.2. Global Corporate Travel Market Size and Forecast, By Service (2025-2032)
4.2.1. Air Travel
4.2.2. Accommodation
4.2.3. Ground Transportation
4.3. Global Corporate Travel Market Size and Forecast, By Traveler (2025-2032)
4.3.1. Solo
4.3.2. Group
4.4. Global Corporate Travel Market Size and Forecast, By End-user Industry (2025-2032)
4.4.1. Finance and Banking
4.4.2. Technology and IT
4.4.3. Healthcare and Pharmaceuticals
4.5. Global Corporate Travel Market Size and Forecast, by region (2025-2032)
4.5.1. North America
4.5.2. Europe
4.5.3. Asia Pacific
4.5.4. Middle East and Africa
4.5.5. South America
5. North America Corporate Travel Market Size and Forecast by Segmentation (by Value in USD Billion) (2025-2032)
5.1. North America Corporate Travel Market Size and Forecast, By Purpose (2025-2032)
5.1.1. Marketing
5.1.2. Meetings (Stone Wool, Rock Wool)
5.1.3. Trade Shows
5.1.4. Product Launch
5.1.5. Others
5.2. North America Corporate Travel Market Size and Forecast, By Service (2025-2032)
5.2.1. Air Travel
5.2.2. Accommodation
5.2.3. Ground Transportation
5.3. North America Corporate Travel Market Size and Forecast, By Traveler (2024-2032
5.3.1. Solo
5.3.2. Group
5.4. North America Corporate Travel Market Size and Forecast, By End-user Industry (2025-2032)
5.4.1. Finance and Banking
5.4.2. Technology and IT
5.4.3. Healthcare and Pharmaceuticals
5.5. North America Corporate Travel Market Size and Forecast, by Country (2025-2032)
5.5.1. United States
5.5.1.1. United States Corporate Travel Market Size and Forecast, By Purpose (2025-2032)
5.5.1.1.1. Marketing
5.5.1.1.2. Meetings (Stone Wool, Rock Wool)
5.5.1.1.3. Trade Shows
5.5.1.1.4. Product Launch
5.5.1.1.5. Others
5.5.1.2. United States Corporate Travel Market Size and Forecast, By Service (2025-2032)
5.5.1.2.1. Air Travel
5.5.1.2.2. Accommodation
5.5.1.2.3. Ground Transportation
5.5.1.3. United States Corporate Travel Market Size and Forecast, By Traveler (2025-2032)
5.5.1.3.1. Solo
5.5.1.3.2. Group
5.5.1.4. United States Corporate Travel Market Size and Forecast, By End-user Industry (2025-2032)
5.5.1.4.1. Finance and Banking
5.5.1.4.2. Technology and IT
5.5.1.4.3. Healthcare and Pharmaceuticals
5.5.2. Canada
5.5.2.1. Canada Corporate Travel Market Size and Forecast, By Purpose (2025-2032)
5.5.2.1.1. Marketing
5.5.2.1.2. Meetings (Stone Wool, Rock Wool)
5.5.2.1.3. Trade Shows
5.5.2.1.4. Product Launch
5.5.2.1.5. Others
5.5.2.2. Canada Corporate Travel Market Size and Forecast, By Service (2025-2032)
5.5.2.2.1. Air Travel
5.5.2.2.2. Accommodation
5.5.2.2.3. Ground Transportation
5.5.2.3. Canada Corporate Travel Market Size and Forecast, By Traveler (2025-2032)
5.5.2.3.1. Solo
5.5.2.3.2. Group
5.5.2.4. Canada Corporate Travel Market Size and Forecast, By End-user Industry (2025-2032)
5.5.2.4.1. Finance and Banking
5.5.2.4.2. Technology and IT
5.5.2.4.3. Healthcare and Pharmaceuticals
5.5.3. Mexico
5.5.3.1. Mexico Corporate Travel Market Size and Forecast, By Purpose (2025-2032)
5.5.3.1.1. Marketing
5.5.3.1.2. Meetings (Stone Wool, Rock Wool)
5.5.3.1.3. Trade Shows
5.5.3.1.4. Product Launch
5.5.3.1.5. Others
5.5.3.2. Mexico Corporate Travel Market Size and Forecast, By Service (2025-2032)
5.5.3.2.1. Air Travel
5.5.3.2.2. Accommodation
5.5.3.2.3. Ground Transportation
5.5.3.3. Mexico Corporate Travel Market Size and Forecast, By Traveler (2025-2032)
5.5.3.3.1. Solo
5.5.3.3.2. Group
5.5.3.4. Mexico Corporate Travel Market Size and Forecast, By End-user Industry (2025-2032)
5.5.3.4.1. Finance and Banking
5.5.3.4.2. Technology and IT
5.5.3.4.3. Healthcare and Pharmaceuticals
6. Europe Corporate Travel Market Size and Forecast by Segmentation (by Value in USD Billion) (2025-2032)
6.1. Europe Corporate Travel Market Size and Forecast, By Purpose (2025-2032)
6.2. Europe Corporate Travel Market Size and Forecast, By Service (2025-2032)
6.3. Europe Corporate Travel Market Size and Forecast, By Traveler (2025-2032)
6.4. Europe Corporate Travel Market Size and Forecast, By End-user Industry (2025-2032)
6.5. Europe Corporate Travel Market Size and Forecast, by Country (2025-2032)
6.5.1. United Kingdom
6.5.1.1. United Kingdom Corporate Travel Market Size and Forecast, By Purpose (2025-2032)
6.5.1.2. United Kingdom Corporate Travel Market Size and Forecast, By Service (2025-2032)
6.5.1.3. United Kingdom Corporate Travel Market Size and Forecast, By Traveler (2025-2032)
6.5.1.4. United Kingdom Corporate Travel Market Size and Forecast, By End-user Industry (2025-2032)
6.5.2. France
6.5.2.1. France Corporate Travel Market Size and Forecast, By Purpose (2025-2032)
6.5.2.2. France Corporate Travel Market Size and Forecast, By Service (2025-2032)
6.5.2.3. France Corporate Travel Market Size and Forecast, By Traveler (2025-2032)
6.5.2.4. France Corporate Travel Market Size and Forecast, By End-user Industry (2025-2032)
6.5.3. Germany
6.5.3.1. Germany Corporate Travel Market Size and Forecast, By Purpose (2025-2032)
6.5.3.2. Germany Corporate Travel Market Size and Forecast, By Service (2025-2032)
6.5.3.3. Germany Corporate Travel Market Size and Forecast, By Traveler (2025-2032)
6.5.3.4. Germany Corporate Travel Market Size and Forecast, By End-user Industry (2025-2032)
6.5.4. Italy
6.5.4.1. Italy Corporate Travel Market Size and Forecast, By Purpose (2025-2032)
6.5.4.2. Italy Corporate Travel Market Size and Forecast, By Service (2025-2032)
6.5.4.3. Italy Corporate Travel Market Size and Forecast, By Traveler (2025-2032)
6.5.4.4. Italy Corporate Travel Market Size and Forecast, By End-user Industry (2025-2032)
6.5.5. Spain
6.5.5.1. Spain Corporate Travel Market Size and Forecast, By Purpose (2025-2032)
6.5.5.2. Spain Corporate Travel Market Size and Forecast, By Service (2025-2032)
6.5.5.3. Spain Corporate Travel Market Size and Forecast, By Traveler (2025-2032)
6.5.5.4. Spain Corporate Travel Market Size and Forecast, By End-user Industry (2025-2032)
6.5.6. Sweden
6.5.6.1. Sweden Corporate Travel Market Size and Forecast, By Purpose (2025-2032)
6.5.6.2. Sweden Corporate Travel Market Size and Forecast, By Service (2025-2032)
6.5.6.3. Sweden Corporate Travel Market Size and Forecast, By Traveler (2025-2032)
6.5.6.4. Sweden Corporate Travel Market Size and Forecast, By End-user Industry (2025-2032)
6.5.7. Austria
6.5.7.1. Austria Corporate Travel Market Size and Forecast, By Purpose (2025-2032)
6.5.7.2. Austria Corporate Travel Market Size and Forecast, By Service (2025-2032)
6.5.7.3. Austria Corporate Travel Market Size and Forecast, By Traveler (2025-2032)
6.5.7.4. Austria Corporate Travel Market Size and Forecast, By End-user Industry (2025-2032)
6.5.8. Rest of Europe
6.5.8.1. Rest of Europe Corporate Travel Market Size and Forecast, By Purpose (2025-2032)
6.5.8.2. Rest of Europe Corporate Travel Market Size and Forecast, By Service (2025-2032)
6.5.8.3. Rest of Europe Corporate Travel Market Size and Forecast, By Traveler (2025-2032)
6.5.8.4. Rest of Europe Corporate Travel Market Size and Forecast, By End-user Industry (2025-2032)
7. Asia Pacific Corporate Travel Market Size and Forecast by Segmentation (by Value in USD Billion) (2025-2032)
7.1. Asia Pacific Corporate Travel Market Size and Forecast, By Purpose (2025-2032)
7.2. Asia Pacific Corporate Travel Market Size and Forecast, By Service (2025-2032)
7.3. Asia Pacific Corporate Travel Market Size and Forecast, By Traveler (2025-2032)
7.4. Asia Pacific Corporate Travel Market Size and Forecast, By End-user Industry (2025-2032)
7.5. Asia Pacific Corporate Travel Market Size and Forecast, by Country (2025-2032)
7.5.1. China
7.5.1.1. China Corporate Travel Market Size and Forecast, By Purpose (2025-2032)
7.5.1.2. China Corporate Travel Market Size and Forecast, By Service (2025-2032)
7.5.1.3. China Corporate Travel Market Size and Forecast, By Traveler (2025-2032)
7.5.1.4. China Corporate Travel Market Size and Forecast, By End-user Industry (2025-2032)
7.5.2. S Korea
7.5.2.1. S Korea Corporate Travel Market Size and Forecast, By Purpose (2025-2032)
7.5.2.2. S Korea Corporate Travel Market Size and Forecast, By Service (2025-2032)
7.5.2.3. S Korea Corporate Travel Market Size and Forecast, By Traveler (2025-2032)
7.5.2.4. S Korea Corporate Travel Market Size and Forecast, By End-user Industry (2025-2032)
7.5.3. Japan
7.5.3.1. Japan Corporate Travel Market Size and Forecast, By Purpose (2025-2032)
7.5.3.2. Japan Corporate Travel Market Size and Forecast, By Service (2025-2032)
7.5.3.3. Japan Corporate Travel Market Size and Forecast, By Traveler (2025-2032)
7.5.3.4. Japan Corporate Travel Market Size and Forecast, By End-user Industry (2025-2032)
7.5.4. India
7.5.4.1. India Corporate Travel Market Size and Forecast, By Purpose (2025-2032)
7.5.4.2. India Corporate Travel Market Size and Forecast, By Service (2025-2032)
7.5.4.3. India Corporate Travel Market Size and Forecast, By Traveler (2025-2032)
7.5.4.4. India Corporate Travel Market Size and Forecast, By End-user Industry (2025-2032)
7.5.5. Australia
7.5.5.1. Australia Corporate Travel Market Size and Forecast, By Purpose (2025-2032)
7.5.5.2. Australia Corporate Travel Market Size and Forecast, By Service (2025-2032)
7.5.5.3. Australia Corporate Travel Market Size and Forecast, By Traveler (2025-2032)
7.5.5.4. Australia Corporate Travel Market Size and Forecast, By End-user Industry (2025-2032)
7.5.6. Indonesia
7.5.6.1. Indonesia Corporate Travel Market Size and Forecast, By Purpose (2025-2032)
7.5.6.2. Indonesia Corporate Travel Market Size and Forecast, By Service (2025-2032)
7.5.6.3. Indonesia Corporate Travel Market Size and Forecast, By Traveler (2025-2032)
7.5.6.4. Indonesia Corporate Travel Market Size and Forecast, By End-user Industry (2025-2032)
7.5.7. Malaysia
7.5.7.1. Malaysia Corporate Travel Market Size and Forecast, By Purpose (2025-2032)
7.5.7.2. Malaysia Corporate Travel Market Size and Forecast, By Service (2025-2032)
7.5.7.3. Malaysia Corporate Travel Market Size and Forecast, By Traveler (2025-2032)
7.5.7.4. Malaysia Corporate Travel Market Size and Forecast, By End-user Industry (2025-2032)
7.5.8. Vietnam
7.5.8.1. Vietnam Corporate Travel Market Size and Forecast, By Purpose (2025-2032)
7.5.8.2. Vietnam Corporate Travel Market Size and Forecast, By Service (2025-2032)
7.5.8.3. Vietnam Corporate Travel Market Size and Forecast, By Traveler (2025-2032)
7.5.8.4. Vietnam Corporate Travel Market Size and Forecast, By End-user Industry (2025-2032)
7.5.9. Philippines
7.5.9.1. Philippines Corporate Travel Market Size and Forecast, By Purpose (2025-2032)
7.5.9.2. Philippines Corporate Travel Market Size and Forecast, By Service (2025-2032)
7.5.9.3. Philippines Corporate Travel Market Size and Forecast, By Traveler (2025-2032)
7.5.9.4. Philippines Corporate Travel Market Size and Forecast, By End-user Industry (2025-2032)
7.5.10. Rest of Asia Pacific
7.5.10.1. Rest of Asia Pacific Corporate Travel Market Size and Forecast, By Purpose (2025-2032)
7.5.10.2. Rest of Asia Pacific Corporate Travel Market Size and Forecast, By Service (2025-2032)
7.5.10.3. Rest of Asia Pacific Corporate Travel Market Size and Forecast, By Traveler (2025-2032)
7.5.10.4. Rest of Asia Pacific Corporate Travel Market Size and Forecast, By End-user Industry (2025-2032)
8. Middle East and Africa Corporate Travel Market Size and Forecast by Segmentation (by Value in USD Billion) (2025-2032)
8.1. Middle East and Africa Corporate Travel Market Size and Forecast, By Purpose (2025-2032)
8.2. Middle East and Africa Corporate Travel Market Size and Forecast, By Service (2025-2032)
8.3. Middle East and Africa Corporate Travel Market Size and Forecast, By Traveler (2025-2032)
8.4. Middle East and Africa Corporate Travel Market Size and Forecast, By End-user Industry (2025-2032)
8.5. Middle East and Africa Corporate Travel Market Size and Forecast, by Country (2025-2032)
8.5.1. South Africa
8.5.1.1. South Africa Corporate Travel Market Size and Forecast, By Purpose (2025-2032)
8.5.1.2. South Africa Corporate Travel Market Size and Forecast, By Service (2025-2032)
8.5.1.3. South Africa Corporate Travel Market Size and Forecast, By Traveler (2025-2032)
8.5.1.4. South Africa Corporate Travel Market Size and Forecast, By End-user Industry (2025-2032)
8.5.2. GCC
8.5.2.1. GCC Corporate Travel Market Size and Forecast, By Purpose (2025-2032)
8.5.2.2. GCC Corporate Travel Market Size and Forecast, By Service (2025-2032)
8.5.2.3. GCC Corporate Travel Market Size and Forecast, By Traveler (2025-2032)
8.5.2.4. GCC Corporate Travel Market Size and Forecast, By End-user Industry (2025-2032)
8.5.3. Nigeria
8.5.3.1. Nigeria Corporate Travel Market Size and Forecast, By Purpose (2025-2032)
8.5.3.2. Nigeria Corporate Travel Market Size and Forecast, By Service (2025-2032)
8.5.3.3. Nigeria Corporate Travel Market Size and Forecast, By Traveler (2025-2032)
8.5.3.4. Nigeria Corporate Travel Market Size and Forecast, By End-user Industry (2025-2032)
8.5.4. Rest of ME&A
8.5.4.1. Rest of ME&A Corporate Travel Market Size and Forecast, By Purpose (2025-2032)
8.5.4.2. Rest of ME&A Corporate Travel Market Size and Forecast, By Service (2025-2032)
8.5.4.3. Rest of ME&A Corporate Travel Market Size and Forecast, By Traveler (2025-2032)
8.5.4.4. Rest of ME&A Corporate Travel Market Size and Forecast, By End-user Industry (2025-2032)
9. South America Corporate Travel Market Size and Forecast by Segmentation (by Value in USD Billion) (2025-2032)
9.1. South America Corporate Travel Market Size and Forecast, By Purpose (2025-2032)
9.2. South America Corporate Travel Market Size and Forecast, By Service (2025-2032)
9.3. South America Corporate Travel Market Size and Forecast, By Traveler (2025-2032)
9.4. South America Corporate Travel Market Size and Forecast, By End-user Industry (2025-2032)
9.5. South America Corporate Travel Market Size and Forecast, by Country (2025-2032)
9.5.1. Brazil
9.5.1.1. Brazil Corporate Travel Market Size and Forecast, By Purpose (2025-2032)
9.5.1.2. Brazil Corporate Travel Market Size and Forecast, By Service (2025-2032)
9.5.1.3. Brazil Corporate Travel Market Size and Forecast, By Traveler (2025-2032)
9.5.1.4. Brazil Corporate Travel Market Size and Forecast, By End-user Industry (2025-2032)
9.5.2. Argentina
9.5.2.1. Argentina Corporate Travel Market Size and Forecast, By Purpose (2025-2032)
9.5.2.2. Argentina Corporate Travel Market Size and Forecast, By Service (2025-2032)
9.5.2.3. Argentina Corporate Travel Market Size and Forecast, By Traveler (2025-2032)
9.5.2.4. Argentina Corporate Travel Market Size and Forecast, By End-user Industry (2025-2032)
9.5.3. Rest Of South America
9.5.3.1. Rest Of South America Corporate Travel Market Size and Forecast, By Purpose (2025-2032)
9.5.3.2. Rest Of South America Corporate Travel Market Size and Forecast, By Service (2025-2032)
9.5.3.3. Rest Of South America Corporate Travel Market Size and Forecast, By Traveler (2025-2032)
9.5.3.4. Rest Of South America Corporate Travel Market Size and Forecast, By End-user Industry (2025-2032)
10. Company Profile: Key Players
10.1 American Express Global Business Travel (USA)
10.1.1. Company Overview
10.1.2. Business Portfolio
10.1.3. Financial Overview
10.1.4. SWOT Analysis
10.1.5. Strategic Analysis
10.1.6. Recent Developments
10.2 TripActions / Navan (USA)
10.3 Direct Travel (USA)
10.4 TravelBank (USA)
10.5 Radius Travel (USA)
10.6 Christopherson Business Travel (USA)
10.7 CorpTrav – Frosch (USA)
10.8 ARTA Travel (USA)
10.9 SAP Concur (Germany)
10.10 Perk – TravelPerk (UK)
10.11 Booking.com for Business – Booking Holdings (Netherlands)
10.12 Corporate Travel Management – CTM (Australia / Europe)
10.13 Travel Leaders Group – Internova (USA / Europe)
10.14 National Express Corporate Travel (UK)
10.15 CT Travel Group (UK)
10.16 Safe Harbors Business Travel (UK)
10.17 Egencia Europe (France / UK operations)
10.18 FCM Travel Solutions (Australia)
10.19 JTB Business Travel (Japan)
10.20 GTI Travel (India)
10.21 Corporate Travel Services (India)
10.22 Yatra Corporate Travel (India)
10.23 WegoPro (UAE / APAC)
10.24 Tumodo (UAE / Middle East & Asia)
11. Key Findings
12. Analyst Recommendations
13. Global Corporate Travel Market: Research Methodology


