Shared Mobility Market Industry Analysis and Forecast (2026-2032) by Network Type, Hardware, Communication Type, End User, Services, and Region
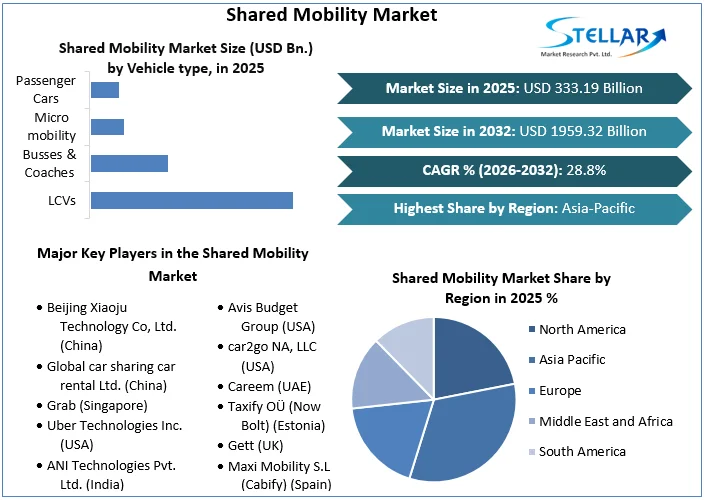
Shared Mobility Market size was valued at US$ 333.19 Billion in 2025 and the total Shared Mobility Market revenue is expected to grow at 28.8% through 2026 to 2032, reaching nearly US$ 1959.32 Billion.
Shared Mobility Market Overview:
Shared mobility is a travel service in which organizations arrange facilities to provide commuting services from one location to another. Owners of some commercial vehicles provide their fleet of vehicles to the organization, which uses these vehicles to provide services such as rentals, carpooling and commuting. The price completely depends on the distance and time the customer reaches the destination. The trend of shared transport has increased significantly in recent years due to many factors such as rapid urbanization, increasing environmental problems, limited energy resources and economic concerns, which are is expected to drive the global shared mobility market. Shared Mobility market is expected to register CAGR of 28.8% during the forecast period. This article describes the different segments of the mobile sharing market and provides an assessment of the current market and its outlook on its current state, with particular emphasis on market size, financial investment and consumer sentiment. SMR also analyse our outlook for the future of the market.
To get more Insights: Request Free Sample Report
Shared Mobility Market Dynamics:
Some key statistics of Shared Mobility Market:
- Over 40 million emails are placed every day on the two biggest email platforms.
- Mobility market accounts for more than 90% of consumer spending on shared mobility worldwide.
- The number of rides has almost tripled in four years, and the number of rides with micro-controllers has more than doubled in a year.
- Auto players make only 5% of all investments in the shared mobility industry
- According to 2020 ACES consumer survey, more than 60% of people would share their ride with a stranger if it increased their travel time by less than 15% while reducing their costs.
The potential expansion of e-hailing, car sharing, urban air mobility and a variety of other mobility solutions is changing the way we travel. Drivers now have a number of affordable and convenient alternatives to vehicle ownership, which will continue to grow over the next decade. The shared mobility market is currently worth over $ 60 billion in the three largest markets of China, Europe and the United States. As self-driving taxis and shuttles become more common and the city's aerial movement passes through the pilot phase, it will bring even greater benefits in the future. With this momentum, the annual growth rate of shared mobility solutions is expected to exceed 20% by 2030.
Shared mobility is a new trend, but it is a very destructive force, rapidly shifting consumer preferences from car ownership to another mode of transportation. Many of the changes it will bring will be positive as the growth of shared mobility market, brings new and profitable opportunities to multiple companies, including automakers, parts suppliers, technology companies and aerospace professionals. For example, the market is relatively small because the vehicles used for airborne transportation in cities are expensive and most people are beyond the scope of private ownership. However, business models where multiple passengers buy vehicle tickets or companies share the cost of transporting goods can make urban air mobility an accessible and affordable option.

Since 2010, greater than $100 billion has been invested in shared-mobility companies. Looking deeper into sorts of traders, it`s now no longer the automobile players which are making an investment in shared mobility market companies. Instead, round seventy two percentage of the overall quantity of disclosed funding considering that 2010 has come from assignment capital and personal-fairness players, suggesting a guess at the destiny instead of on mounted and already sustainable commercial enterprise models. Tech gamers are 2nd at about 21%, whilst automobile-corporation investments quantity to about 4%. One purpose for the conventional automobile enterprise`s slackness in displaying may want to contain shared mobility`s ability for disrupting an automobile player`s middle commercial enterprise. Some automobile OEMs have tried to stand the task via in-residence projects instead of investments in external, new start-ups. This shows a mind-set shift from promoting cars to imparting shared-mobility offerings, whilst the latter can also additionally even cannibalize OEMs` middle commercial enterprise of promoting automobiles to personal individuals.
The e-hailing marketplace bills for greater than $ninety five billion in investments; kind of 1/2 of all e-hailing investments have targeted at the 3 biggest worldwide gamers. The middle e-hailing commercial enterprise version seeks to gain (asset-free) get admission to drivers and clients instead of constructing fleets and working cars, which appears to be appealing for traders. However, for traders it`s a guess at the destiny. Robo-taxis and shuttles may want to end up a recreation changer withinside the e-hailing marketplace (because of anticipated decrease working value as compared to driver-primarily based totally offerings); traders are awaiting enterprise gamers to commercialize autonomous-using era and end up worthwhile at a massive scale.

The shared-micromobility marketplace continues developing and indicates a excessive diploma of funding acceleration. While shared electric powered scooters have entered Shared Mobility Market at massive scale as lately as 2017, shared-micromobility gamers have already attracted investment investments of greater than $9 billion, setting that phase 2nd in the back of e-hailing gamers. This displays the increased uptake in shared-micromobility journeys as mentioned withinside the segment on marketplace size. The investments withinside the vehicle-sharing marketplace, at about $three billion, are small as compared with investments in e-hailing. On the only hand, a few automobile OEMs increase vehicle-sharing offerings in-residence and leverage the possibility to deliver their personal cars into the fleet at decrease charge factors, which offers benefits in working expenses to start-ups.
On the other hand, the decrease investments mirror the shared mobility market traits as mentioned withinside the preceding segment. While the range of vehicle-sharing journeys remained fairly small, e-hailing rides almost tripled. Likewise, the range of electric powered-scooter rides expanded exponentially, indicating that the scale-up of asset-mild businesses, along with those who serve micromobility and e-hailing, require an awful lot decrease investments as compared with asset-heavy businesses, along with vehicle sharing. It additionally factors to a few customer ache factors and demanding situations withinside the vehicle-sharing carrier that e-hailing can solve. These encompass using a non-public automobile in congested traffic, finding and on foot to the automobile, and locating a parking spot on the destination
Shared Mobility Market Segmentation:
E Hailing has retained the dominant role in the Market:
Looking at the evolution of travel development over time, NHTSA survey shows that e-hailing maintained a clear dominant role in the shared mobility market from 2016 to 2019, recording significant growth over the last four years. (The number of trips is tripled). Shared micromobility is evolving even more powerfully. Sharing electric scooters wasn't a big deal before 2017, but accelerated in 2018 and 2019 (from less than 1 million rides in 2017 to more than 160 million rides in 2019). With the biggest player). SMR model shows that micromobility has the potential to reach $ 300-500 billion in personal consumption potential worldwide by 2030 (given the combination of shared and private micromobility). This is three to four times the size of today's global electronic hailing market. The amount is expected to increase as the pandemic subsides and normal activity resumes.

Shared Mobility Market Trends:
- Subscription service: growing strongly:
The need for flexible personal mobility is increasing, especially due to the pandemic. Customers want to own their own vehicles but do not want to be tied down; they want to rent in short time with transparent price and low fixed cost. Car registration bridges the gap between renting or leasing a vehicle and owning a car. There are many dynamics in the shared mobility market: vendors like Cluno and Vive la Car have been around for a while. The VW WeShare car-sharing service recently reacted: customers can now purchase a cancelable monthly subscription and benefit from cheaper rates. Finn.auto founder, MaxJosel Meier, has been offering a subscription model since last year and has just convinced investors to invest another 20 million euros. Chinese supplier Geely announced Lynk subscription offer in Europe for 2024.
- Scooter sharing: underrated potential:
Since 2012, motorcycles share remained unchanged in the shared mobility market, so far always at an extensible level. Especially in urban areas, user numbers are currently on the rise. According to the latest moped sharing study, the number of shared mopeds worldwide has risen by 58 percent in the past year from 66,000 to 104,000 vehicles today, and the number of registered users has even increased from 5 million to 9 million, i.e. by 80%. The vehicles are robust and durable, comfortable and make finding a parking space easy. In addition, providers have not yet tapped into many cities and regions: in the UK, France, Italy, and throughout Eastern Europe, there is still considerable untapped opportunities.
- Electric Bike: The Next Shared Mobility Hype:
Electric bicycles are conquering the street. Since the pandemic, many cities like Paris and Cologne have not only turned lanes into bike paths. In the next step, they reached the shared mobility industry. For example, Lime and FreeNow have already incorporated electric bike sharing into their program in Hamburg in September 2020. Wheels combined a scooter with an electric bike to create its own vehicle in Berlin. At the end of 2020, Dot announced that in addition to its successful scooter sharing service, it will offer electric bike sharing to customers in London and Paris from March 2021. Other competitors are already in the starting blocks, according to industry insiders.
Shared Mobility Market Regional Insights:
APAC region accounted for 38% shared mobility market share as private transport remains the most popular means of transport in most countries. Globally, 67% of respondents said they regularly use private vehicles (i.e. at least once a week), while 38% said they regularly use public transport. Car sharing is the least used method by the average consumer today, which reflects a decline in the number of journeys. Email is most popular with consumers in Brazil, China, and the United States. In China, 90% of consumers say they use an email service at least once a week.
When it comes to commuting to work, which is the largest use of transportation, personal vehicles are the preferred means of transport overall, especially in the United States. This preference is comparably low in China—most likely due to the uneven distribution of cars. But if all transportation modes were available, around 33% of Chinese respondents would see shared mobility as the preferred transportation mode for commuting, with the use of private vehicles in second place.
China, Korea and Japan account for the largest Shared mobility market share in the Asia-Pacific region. The growth of the Asia-Pacific market is driven by increased automobile production and increased use of advanced electronics in Japan, Korea and China. Realizing the growth potential of the auto industry, the governments of these countries have implemented various initiatives to encourage large OEMs to enter the domestic market. Some Western automakers such as Volkswagen (Germany), Mercedes Benz (Germany) and General Motors (USA) have moved production facilities to developing countries.
Major Shared mobility solution providers have production facilities throughout the region. Despite the slowdown in vehicle sales due to the COVID 19 pandemic, existing safety regulations will certainly facilitate the penetration of ADAS functions into future vehicles. For example, China has mandated TPMS on vehicles since 2019. The country is also considering mandating automatic emergency braking during the forecast period. In addition, the Chinese government has announced several steps to promote economic recovery, including stabilizing domestic consumption, supporting the development of new energy vehicles, and other monetary and fiscal policies. As a result, the automotive industry is projected to improve significantly in the second quarter of 2020. Financial assistance, future obligations and growth of Chinese OEMs will drive demand for domestic driver assistance systems.
The objective of the report is to present a comprehensive analysis of the Shared Mobility Market to the stakeholders in the industry. The report provides trends that are most dominant in the Shared Mobility Market and how these trends will influence new business investments and market development throughout the forecast period. The report also aids in the comprehension of the global market dynamics and competitive structure of the market by analyzing market leaders, market followers, and regional players.
The qualitative and quantitative data provided in the Shared Mobility Market report is to help understand which market segments, regions are expected to grow at higher rates, factors affecting the market, and key opportunity areas, which will drive the industry and market growth through the forecast period. The report also includes the competitive landscape of key players in the industry along with their recent developments in the Shared Mobility Market. The report studies factors such as company size, market share, market growth, revenue, production volume, and profits of the key players in the global market.
The report provides Porter's Five Force Model, which helps in designing the business strategies in the market. The report helps in identifying how many rivals are existing, who they are, and how their product quality is in the Market. The report also analyses if the Shared Mobility Market is easy for a new player to gain a foothold in the market, do they enter or exit the market regularly if the market is dominated by a few players, etc.
The report also includes a PESTEL Analysis, which aids in the development of company strategies. Political variables help in figuring out how much a government can influence the Market. Economic variables aid in the analysis of economic performance drivers that have an impact on the Market. Understanding the impact of the surrounding environment and the influence of environmental concerns on the Shared Mobility Market is aided by legal factors.
Shared Mobility Market Scope:
|
Shared Mobility Market |
|
|
Market Size in 2025 |
USD 333.19 Bn. |
|
Market Size in 2032 |
USD 1959.32 Bn. |
|
CAGR (2025-2032) |
28.8% |
|
Historic Data |
2020-2025 |
|
Base Year |
2025 |
|
Forecast Period |
2026-2032 |
|
Segment Scope |
by Vehicle type
|
|
by Services • Bike Sharing • Ride Sharing • Car Sharing • Ride Hailing |
|
|
by Business model • P2P • B2B • B2C |
|
|
by Power Source • Hybrid Electric Vehicle (HEV) • Plug-in Hybrid Electric Vehicle (PHEV) • Fuel Powered • Battery Electric Vehicle (BEV) |
|
|
Regional Scope |
North America- United States, Canada, and Mexico Europe – UK, France, Germany, Italy, Spain, Sweden, Austria, and Rest of Europe Asia Pacific – China, India, Japan, South Korea, Australia, ASEAN, Rest of APAC Middle East and Africa - South Africa, GCC, Egypt, Nigeria, Rest of the Middle East and Africa South America – Brazil, Argentina, Rest of South America |
Shared Mobility Market Players:
- Beijing Xiaoju Technology Co, Ltd. (China)
- Global car sharing car rental Ltd. (China)
- Grab (Singapore)
- Uber Technologies Inc. (USA)
- ANI Technologies Pvt. Ltd. (India)
- Lyft Inc. (USA)
- Avis Budget Group (USA)
- car2go NA, LLC (USA)
- Careem (UAE)
- Taxify OÜ (Now Bolt) (Estonia)
- Gett (UK)
- Maxi Mobility S.L (Cabify) (Spain)
Frequently Asked Questions
APAC region have the highest growth rate in the Shared Mobility market.
Beijing Xiaoju Technology Co, Ltd. (China), Global car sharing car rental Ltd. (China), Grab (Singapore), Uber Technologies Inc. (USA), ANI Technologies Pvt. Ltd. (India), Lyft Inc. (USA), Avis Budget Group (USA), car2go NA, LLC (USA), Careem (UAE), Taxify OÜ (Now Bolt) (Estonia), Gett (UK), Maxi Mobility S.L (Cabify) (Spain) are the key players in the Shared Mobility market.
Passenger Cars segment is dominating the market owing to increasing purchasing rate of the passenger cars and low installation cost of sharing autonomy in the vehicles.
Chapter 1 Scope of the Report
Chapter 2 Research Methodology
2.1. Research Process
2.2. Global Shared Mobility Market: Target Audience
2.3. Global Shared Mobility Market: Primary Research (As per Client Requirement)
2.4. Global Shared Mobility Market: Secondary Research
Chapter 3 Executive Summary
Chapter 4 Competitive Landscape
4.1. Market Share Analysis, By Value,2025-2032
4.1.1. Market Share Analysis, By Region, By Value,2025-2032 (In %)
4.1.1.1. North America Market Share Analysis, By Value,2025-2032 (In %)
4.1.1.2. Europe Market Share Analysis, By Value,2025-2032 (In %)
4.1.1.3. Asia Pacific Market Share Analysis, By Value,2025-2032 (In %)
4.1.1.4. South America Market Share Analysis, By Value,2025-2032 (In %)
4.1.1.5. Middle East and Africa Market Share Analysis, By Value,2025-2032 (In %)
4.1.2. Market Share Analysis, By Vehicle Type, By Value,2025-2032 (In %)
4.1.2.1. North America Market Share Analysis, By Vehicle Type, By Value,2025-2032 (In %)
4.1.2.1.1. USA Market Share Analysis, By Vehicle Type, By Value,2025-2032 (In %)
4.1.2.1.2. Canada Market Share Analysis, By Vehicle Type, By Value,2025-2032 (In %)
4.1.2.1.3. Mexico Market Share Analysis, By Vehicle Type, By Value,2025-2032 (In %)
4.1.2.2. Europe Market Share Analysis, By Vehicle Type, By Value,2025-2032 (In %)
4.1.2.2.1. UK Market Share Analysis, By Vehicle Type, By Value,2025-2032 (In %)
4.1.2.2.2. France Market Share Analysis, By Vehicle Type, By Value,2025-2032 (In %)
4.1.2.2.3. Germany Market Share Analysis, By Vehicle Type, By Value,2025-2032 (In %)
4.1.2.2.4. Italy Market Share Analysis, By Vehicle Type, By Value,2025-2032 (In %)
4.1.2.2.5. Spain Market Share Analysis, By Vehicle Type, By Value,2025-2032 (In %)
4.1.2.2.6. Sweden Market Share Analysis, By Vehicle Type, By Value,2025-2032 (In %)
4.1.2.2.7. Austria Market Share Analysis, By Vehicle Type, By Value,2025-2032 (In %)
4.1.2.2.8. Rest of Europe Market Share Analysis, By Vehicle Type, By Value,2025-2032 (In %)
4.1.2.3. Asia Pacific Market Share Analysis, By Vehicle Type, By Value,2025-2032 (In %)
4.1.2.3.1. China Market Share Analysis, By Vehicle Type, By Value,2025-2032 (In %)
4.1.2.3.2. India Market Share Analysis, By Vehicle Type, By Value,2025-2032 (In %)
4.1.2.3.3. Japan Market Share Analysis, By Vehicle Type, By Value,2025-2032 (In %)
4.1.2.3.4. South Korea Market Share Analysis, By Vehicle Type, By Value,2025-2032 (In %)
4.1.2.3.5. Australia Market Share Analysis, By Vehicle Type, By Value,2025-2032 (In %)
4.1.2.3.6. ASEAN Market Share Analysis, By Vehicle Type, By Value,2025-2032 (In %)
4.1.2.3.7. Rest of APAC Market Share Analysis, By Vehicle Type, By Value,2025-2032 (In %)
4.1.2.4. South America Market Share Analysis, By Vehicle Type, By Value,2025-2032 (In %)
4.1.2.4.1. Brazil Market Share Analysis, By Vehicle Type, By Value,2025-2032 (In %)
4.1.2.4.2. Argentina Market Share Analysis, By Vehicle Type, By Value,2025-2032 (In %)
4.1.2.4.3. Rest of South America Market Share Analysis, By Vehicle Type, By Value,2025-2032 (In %)
4.1.2.5. Middle East and Africa Market Share Analysis, By Vehicle Type, By Value,2025-2032 (In %)
4.1.2.5.1. South Africa Market Share Analysis, By Vehicle Type, By Value,2025-2032 (In %)
4.1.2.5.2. GCC Market Share Analysis, By Vehicle Type, By Value,2025-2032 (In %)
4.1.2.5.3. Egypt Market Share Analysis, By Vehicle Type, By Value,2025-2032 (In %)
4.1.2.5.4. Nigeria Market Share Analysis, By Vehicle Type, By Value,2025-2032 (In %)
4.1.2.5.5. Rest of Middle East and Africa Market Share Analysis, By Vehicle Type, By Value,2025-2032 (In %)
4.1.3. Market Share Analysis, By Services, By Value,2025-2032 (In %)
4.1.4. North America Market Share Analysis, By Services, By Value,2025-2032 (In %)
4.1.4.1.1. USA Market Share Analysis, By Services, By Value,2025-2032 (In %)
4.1.4.1.2. Canada Market Share Analysis, By Services, By Value,2025-2032 (In %)
4.1.4.1.3. Mexico Market Share Analysis, By Services, By Value,2025-2032 (In %)
4.1.4.2. Europe Market Share Analysis, By Services, By Value,2025-2032 (In %)
4.1.4.2.1. UK Market Share Analysis, By Services, By Value,2025-2032 (In %)
4.1.4.2.2. France Market Share Analysis, By Services, By Value,2025-2032 (In %)
4.1.4.2.3. Germany Market Share Analysis, By Services, By Value,2025-2032 (In %)
4.1.4.2.4. Italy Market Share Analysis, By Services, By Value,2025-2032 (In %)
4.1.4.2.5. Spain Market Share Analysis, By Services, By Value,2025-2032 (In %)
4.1.4.2.6. Sweden Market Share Analysis, By Services, By Value,2025-2032 (In %)
4.1.4.2.7. Austria Market Share Analysis, By Services, By Value,2025-2032 (In %)
4.1.4.2.8. Rest of Europe Market Share Analysis, By Services, By Value,2025-2032 (In %)
4.1.4.3. Asia Pacific Market Share Analysis, By Services, By Value,2025-2032 (In %)
4.1.4.3.1. China Market Share Analysis, By Services, By Value,2025-2032 (In %)
4.1.4.3.2. India Market Share Analysis, By Services, By Value,2025-2032 (In %)
4.1.4.3.3. Japan Market Share Analysis, By Services, By Value,2025-2032 (In %)
4.1.4.3.4. South Korea Market Share Analysis, By Services, By Value,2025-2032 (In %)
4.1.4.3.5. Australia Market Share Analysis, By Services, By Value,2025-2032 (In %)
4.1.4.3.6. ASEAN Market Share Analysis, By Services, By Value,2025-2032 (In %)
4.1.4.3.7. Rest of APAC Market Share Analysis, By Services, By Value,2025-2032 (In %)
4.1.4.4. South America Market Share Analysis, By Services, By Value,2025-2032 (In %)
4.1.4.4.1. Brazil Market Share Analysis, By Services, By Value,2025-2032 (In %)
4.1.4.4.2. Argentina Market Share Analysis, By Services, By Value,2025-2032 (In %)
4.1.4.4.3. Rest of South America Market Share Analysis, By Services, By Value,2025-2032 (In %)
4.1.4.5. Middle East and Africa Market Share Analysis, By Services, By Value,2025-2032 (In %)
4.1.4.5.1. South Africa Market Share Analysis, By Services, By Value,2025-2032 (In %)
4.1.4.5.2. GCC Market Share Analysis, By Services, By Value,2025-2032 (In %)
4.1.4.5.3. Egypt Market Share Analysis, By Services, By Value,2025-2032 (In %)
4.1.4.5.4. Nigeria Market Share Analysis, By Services, By Value,2025-2032 (In %)
4.1.4.5.5. Rest of Middle East and Africa Market Share Analysis, By Services, By Value,2025-2032 (In %)
4.1.5. Market Share Analysis, By Power Source, By Value,2025-2032 (In %)
4.1.6. North America Market Share Analysis, By Power Source, By Value,2025-2032 (In %)
4.1.6.1.1. USA Market Share Analysis, By Power Source, By Value,2025-2032 (In %)
4.1.6.1.2. Canada Market Share Analysis, By Power Source, By Value,2025-2032 (In %)
4.1.6.1.3. Mexico Market Share Analysis, By Power Source, By Value,2025-2032 (In %)
4.1.6.2. Europe Market Share Analysis, By Power Source, By Value,2025-2032 (In %)
4.1.6.2.1. UK Market Share Analysis, By Power Source, By Value,2025-2032 (In %)
4.1.6.2.2. France Market Share Analysis, By Power Source, By Value,2025-2032 (In %)
4.1.6.2.3. Germany Market Share Analysis, By Power Source, By Value,2025-2032 (In %)
4.1.6.2.4. Italy Market Share Analysis, By Power Source, By Value,2025-2032 (In %)
4.1.6.2.5. Spain Market Share Analysis, By Power Source, By Value,2025-2032 (In %)
4.1.6.2.6. Sweden Market Share Analysis, By Power Source, By Value,2025-2032 (In %)
4.1.6.2.7. Austria Market Share Analysis, By Power Source, By Value,2025-2032 (In %)
4.1.6.2.8. Rest of Europe Market Share Analysis, By Power Source, By Value,2025-2032 (In %)
4.1.6.3. Asia Pacific Market Share Analysis, By Power Source, By Value,2025-2032 (In %)
4.1.6.3.1. China Market Share Analysis, By Power Source, By Value,2025-2032 (In %)
4.1.6.3.2. India Market Share Analysis, By Power Source, By Value,2025-2032 (In %)
4.1.6.3.3. Japan Market Share Analysis, By Power Source, By Value,2025-2032 (In %)
4.1.6.3.4. South Korea Market Share Analysis, By Power Source, By Value,2025-2032 (In %)
4.1.6.3.5. Australia Market Share Analysis, By Power Source, By Value,2025-2032 (In %)
4.1.6.3.6. ASEAN Market Share Analysis, By Power Source, By Value,2025-2032 (In %)
4.1.6.3.7. Rest of APAC Market Share Analysis, By Power Source, By Value,2025-2032 (In %)
4.1.6.4. South America Market Share Analysis, By Power Source, By Value,2025-2032 (In %)
4.1.6.4.1. Brazil Market Share Analysis, By Power Source, By Value,2025-2032 (In %)
4.1.6.4.2. Argentina Market Share Analysis, By Power Source, By Value,2025-2032 (In %)
4.1.6.4.3. Rest of South America Market Share Analysis, By Power Source, By Value,2025-2032 (In %)
4.1.6.5. Middle East and Africa Market Share Analysis, By Power Source, By Value,2025-2032 (In %)
4.1.6.5.1. South Africa Market Share Analysis, By Power Source, By Value,2025-2032 (In %)
4.1.6.5.2. GCC Market Share Analysis, By Power Source, By Value,2025-2032 (In %)
4.1.6.5.3. Egypt Market Share Analysis, By Power Source, By Value,2025-2032 (In %)
4.1.6.5.4. Nigeria Market Share Analysis, By Power Source, By Value,2025-2032 (In %)
4.1.6.5.5. Rest of Middle East and Africa Market Share Analysis, By Power Source, By Value,2025-2032 (In %)
4.1.7. Market Share Analysis, By Business Model, By Value,2025-2032 (In %)
4.1.8. North America Market Share Analysis, By Business Model, By Value,2025-2032 (In %)
4.1.8.1.1. USA Market Share Analysis, By Business Model, By Value,2025-2032 (In %)
4.1.8.1.2. Canada Market Share Analysis, By Business Model, By Value,2025-2032 (In %)
4.1.8.1.3. Mexico Market Share Analysis, By Business Model, By Value,2025-2032 (In %)
4.1.8.2. Europe Market Share Analysis, By Business Model, By Value,2025-2032 (In %)
4.1.8.2.1. UK Market Share Analysis, By Business Model, By Value,2025-2032 (In %)
4.1.8.2.2. France Market Share Analysis, By Business Model, By Value,2025-2032 (In %)
4.1.8.2.3. Germany Market Share Analysis, By Business Model, By Value,2025-2032 (In %)
4.1.8.2.4. Italy Market Share Analysis, By Business Model, By Value,2025-2032 (In %)
4.1.8.2.5. Spain Market Share Analysis, By Business Model, By Value,2025-2032 (In %)
4.1.8.2.6. Sweden Market Share Analysis, By Business Model, By Value,2025-2032 (In %)
4.1.8.2.7. Austria Market Share Analysis, By Business Model, By Value,2025-2032 (In %)
4.1.8.2.8. Rest of Europe Market Share Analysis, By Business Model, By Value,2025-2032 (In %)
4.1.8.3. Asia Pacific Market Share Analysis, By Business Model, By Value,2025-2032 (In %)
4.1.8.3.1. China Market Share Analysis, By Business Model, By Value,2025-2032 (In %)
4.1.8.3.2. India Market Share Analysis, By Business Model, By Value,2025-2032 (In %)
4.1.8.3.3. Japan Market Share Analysis, By Business Model, By Value,2025-2032 (In %)
4.1.8.3.4. South Korea Market Share Analysis, By Business Model, By Value,2025-2032 (In %)
4.1.8.3.5. Australia Market Share Analysis, By Business Model, By Value,2025-2032 (In %)
4.1.8.3.6. ASEAN Market Share Analysis, By Business Model, By Value,2025-2032 (In %)
4.1.8.3.7. Rest of APAC Market Share Analysis, By Business Model, By Value,2025-2032 (In %)
4.1.8.4. South America Market Share Analysis, By Business Model, By Value,2025-2032 (In %)
4.1.8.4.1. Brazil Market Share Analysis, By Business Model, By Value,2025-2032 (In %)
4.1.8.4.2. Argentina Market Share Analysis, By Business Model, By Value,2025-2032 (In %)
4.1.8.4.3. Rest of South America Market Share Analysis, By Business Model, By Value,2025-2032 (In %)
4.1.8.5. Middle East and Africa Market Share Analysis, By Business Model, By Value,2025-2032 (In %)
4.1.8.5.1. South Africa Market Share Analysis, By Business Model, By Value,2025-2032 (In %)
4.1.8.5.2. GCC Market Share Analysis, By Business Model, By Value,2025-2032 (In %)
4.1.8.5.3. Egypt Market Share Analysis, By Business Model, By Value,2025-2032 (In %)
4.1.8.5.4. Nigeria Market Share Analysis, By Business Model, By Value,2025-2032 (In %)
4.1.8.5.5. Rest of Middle East and Africa Market Share Analysis, By Business Model, By Value,2025-2032 (In %)
4.2. Stellar Competition matrix
4.2.1. Global Stellar Competition Matrix
4.2.2. North America Stellar Competition Matrix
4.2.3. Europe Stellar Competition Matrix
4.2.4. Asia Pacific Stellar Competition Matrix
4.2.5. South America Stellar Competition Matrix
4.2.6. Middle East and Africa Stellar Competition Matrix
4.3. Key Players Benchmarking
4.3.1. Key Players Benchmarking by Product, Pricing, Market Share, Investments, Expansion Plans, Physical Presence and Presence in the Market.
4.4. Mergers and Acquisitions in Industry
4.4.1. M&A by Region, Value and Strategic Intent
4.5. Market Dynamics
4.5.1. Market Drivers
4.5.2. Market Restraints
4.5.3. Market Opportunities
4.5.4. Market Challenges
4.5.5. PESTLE Analysis
4.5.6. PORTERS Five Force Analysis
4.5.7. Value Chain Analysis
Chapter 5 Global Shared Mobility Market Segmentation: By Vehicle Type
5.1. Global Shared Mobility Market, By Vehicle Type, Overview/Analysis,2025-2032
5.2. Global Shared Mobility Market, By Vehicle Type, By Value, Market Share (%),2025-2032 (USD Million)
5.3. Global Shared Mobility Market, By Vehicle Type, By Value,
5.3.1. LCVs
5.3.2. Busses & Coaches
5.3.3. Micro mobility
5.3.4. Passenger Cars
Chapter 6 Global Shared Mobility Market Segmentation: By Services
6.1. Global Shared Mobility Market, By Services, Overview/Analysis,2025-2032
6.2. Global Shared Mobility Market Size, By Services, By Value, Market Share (%),2025-2032 (USD Million)
6.3. Global Shared Mobility Market, By Services, By Value,
6.3.1. Bike Sharing
6.3.2. Ride Sharing
6.3.3. Car Sharing
6.3.4. Ride Hailing
Chapter 7 Global Shared Mobility Market Segmentation: By Power Source
7.1. Global Shared Mobility Market, By Power Source, Overview/Analysis,2025-2032
7.2. Global Shared Mobility Market Size, By Power Source, By Value, Market Share (%),2025-2032 (USD Million)
7.3. Global Shared Mobility Market, By Power Source, By Value, -
7.3.1. Hybrid Electric Vehicle (HEV)
7.3.2. Plug-in Hybrid Electric Vehicle (PHEV)
7.3.3. Fuel Powered
7.3.4. Battery Electric Vehicle (BEV)
Chapter 8 Global Shared Mobility Market Segmentation: By Business Model
8.1. Global Shared Mobility Market, By Business Model, Overview/Analysis,2025-2032
8.2. Global Shared Mobility Market Size, By Business Model, By Value, Market Share (%),2025-2032 (USD Million)
8.3. Global Shared Mobility Market, By Business Model, By Value, -
8.3.1. P2P
8.3.2. B2B
8.3.3. B2C
Chapter 9 Global Shared Mobility Market Segmentation: By Region
9.1. Global Shared Mobility Market, By Region – North America
9.1.1. North America Shared Mobility Market Size, By Vehicle Type, By Value,2025-2032 (USD Million)
9.1.2. North America Shared Mobility Market Size, By Services, By Value,2025-2032 (USD Million)
9.1.3. North America Shared Mobility Market Size, By Business Model, By Value,2025-2032 (USD Million)
9.1.4. North America Shared Mobility Market Size, By Power Source, By Value,2025-2032 (USD Million)
9.1.5. By Country – U.S.
9.1.5.1. U.S. Shared Mobility Market Size, By Vehicle Type, By Value,2025-2032 (USD Million)
9.1.5.2. U.S. Shared Mobility Market Size, By Services, By Value,2025-2032 (USD Million)
9.1.5.3. U.S. Shared Mobility Market Size, By Business Model, By Value,2025-2032 (USD Million)
9.1.5.4. U.S. Shared Mobility Market Size, By Power Source, By Value,2025-2032 (USD Million)
9.1.5.5. Canada Shared Mobility Market Size, By Value,2025-2032 (USD Million)
9.1.5.6. Mexico Shared Mobility Market Size, By Value,2025-2032 (USD Million)
9.2. Europe Shared Mobility Market Size, By Value,2025-2032 (USD Million)
9.2.1. UK
9.2.2. France
9.2.3. Germany
9.2.4. Italy
9.2.5. Spain
9.2.6. Sweden
9.2.7. Austria
9.2.8. Rest of Europe
9.3. Asia Pacific Shared Mobility Market Size, By Value,2025-2032 (USD Million)
9.3.1. China
9.3.2. India
9.3.3. Japan
9.3.4. South Korea
9.3.5. Australia
9.3.6. ASEAN
9.3.7. Rest of APAC
9.4. Middle East and Africa Shared Mobility Market Size, By Value,2025-2032 (USD Million)
9.4.1. South Africa
9.4.2. GCC
9.4.3. Egypt
9.4.4. Nigeria
9.4.5. Rest of Middle East and Africa
9.5. South America Shared Mobility Market Size, By Value,2025-2032 (USD Million)
9.5.1. Brazil
9.5.2. Argentina
9.5.3. Rest of South America
Chapter 10 Company Profiles
10.1. Key Players
10.1.1. Beijing Xiaoju Technology Co, Ltd. (China)
10.1.1.1. Company Overview
10.1.1.2. Vehicle Type Portfolio
10.1.1.3. Financial Overview
10.1.1.4. Business Strategy
10.1.1.5. Key Developments
10.1.2. Global car sharing car rental Ltd. (China)
10.1.3. Grab (Singapore)
10.1.4. Uber Technologies Inc. (USA)
10.1.5. ANI Technologies Pvt. Ltd. (India)
10.1.6. Lyft Inc. (USA)
10.1.7. Avis Budget Group (USA)
10.1.8. car2go NA, LLC (USA)
10.1.9. Careem (UAE)
10.1.10. Taxify OÜ (Now Bolt) (Estonia)
10.1.11. Gett (UK)
10.1.12. Maxi Mobility S.L (Cabify) (Spain)
10.2. Key Findings
10.3. Recommendations