Network Switches Market Global Industry Analysis and Forecast (2026-2032)
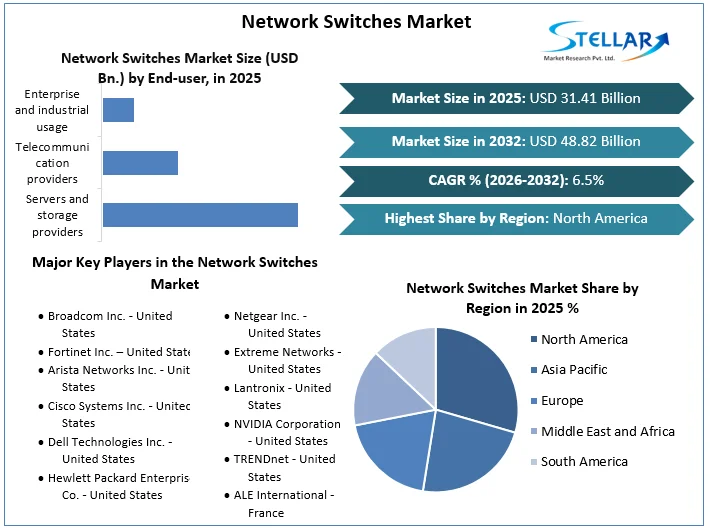
Network Switches Market size was valued at USD 31.41 Bn. in 2025 and the total Network Switches Market revenue is expected to grow at a CAGR of 6.5% from 2026 to 2032, reaching nearly USD 48.82 Bn. by 2032.
Network Switches Market Overview
Network switches are used for networking and devices that connect many devices within a local area network (LAN), and they are sold throughout the world. Network switches are Effective data transfer between connected devices is made possible by their operation at the OSI model's data link layer. To choose the best route for forwarding incoming data packets, switches examine the destination MAC addresses. It also allows them to avoid network overload by developing dedicated communication channels.
Different network speeds, including Fast Ethernet, Gigabit Ethernet, and 10 Gigabit Ethernet, are able to be supported by switches, which also vary in their port capacities. As compared to hubs or repeaters, they provide better scalability, security, and performance. In today’s network environments, network switches facilitate dependable and efficient data transmission through features like Quality of Service (QoS) prioritizing and Virtual Local Area Network (VLAN) support.
To get more Insights: Request Free Sample Report
Network Switches Market Dynamics
Trends in the Network Switches Market
With the increasing adoption of cutting-edge technologies like edge computing, AI, IoT, 5G, and ML applications, IT infrastructure has experienced an amazing transformation. These technologies are being adopted by several industries, including as smart agriculture, smart infrastructure, retail, manufacturing, logistics, aerospace and security systems, healthcare and life sciences, and finance. Because of 5G technology's quicker data transfer rates and all-encompassing internet connectivity, several businesses have also experienced immense development.
Growing customer and application bases have resulted in a huge increase in data loads. Huge necessitate higher bandwidth transfers of huge data quantities to servers and storage systems, which calls for more advanced network switches. The overall amount of data is expected to grow to 463 Exabytes by 2025. In addition, by 2025, there are 75 billion more Internet of Things (IoT) devices on the planet, which is going to increase the data expenses on local servers and data center operations. Consequently, network switch vendors see an increase in the market potential brought about by each of these trends. Therefore, during the forecast period, these factors support the expansion of the global market.
Restraints in the Network Switches Market
There are difficulties in the network switches market that must be overcome to continue growing. The large initial investment needed for deploying network switches, which includes the price of the hardware, installation, and network infrastructure improvements, is one major barrier. For small and medium-sized enterprises with tight funds, this impact be a turnoff. In addition, companies without technical backgrounds face difficulties because of the complexity of network switches and the requirement for trained IT people for installation, configuration, and maintenance.
Also, alternative networking solutions that provide flexibility and cost reductions, such as software-defined networking (SDN) and wireless networks, are competing in the market. Network switches are at risk of hacking because they are essential for connecting different devices. Switch security flaws result in data leaks, illegal access, and interrupted services. The adoption of network switches is impeded by the perceived issues related to network security.
Challenges in the Network Switches Market
A significant challenge for industry growth is the high operational expenses of network switches. When operating a network, network switches are very useful, but development and research come at a heavy cost. With the addition of CPUs, memory, cabling, and connectors, these switches become more expensive. Larger manufacturers such as Intel and Broadcom provide small 5-port devices for about USD 100, while a 24-48 port switch is able to run into the figures.
The cost of a network switch grows higher because of additional security features, which are among the most important features in the current generation of network switches. after each cycle, new network switches have to be bought to replace the older ones. As a result, end users' operating costs rise. Thus, during the projection period, the high operational costs of network switches provide an important barrier to the growth of the global market.
Network Switches Market Segment Analysis
Based on Type the managed, unmanaged, fixed-configuration, PoE, and modular switches are the several types of switches that make up the Network Switches Market. In the networking sector, the segment with the biggest market share at the moment is managed switches. This power is attributable to several things, including managed switches that offer cutting-edge features and functions to meet the precise networking needs of businesses. They enable effective network management and improved performance by providing features including link aggregation, QoS priority, VLAN support, and advanced security features.
Increased management and configuration features are offered by the managed switches, enabling network managers to keep an eye on and manage network traffic, identify problems, and improve network efficiency. In addition, flexible managed switches enable enterprises to evolve their networks in response to changing requirements. Managed switches hold an important share of the market because of their substantial customization and management capabilities, which make them the go-to option for businesses looking to optimize performance and gain complete control.

Switching Port, the markets for network switches are segmented into 100 MBE & 1 GBE, 2.5 GBE & 5 GBE, 10 GBE, 25 GBE & 50 GBE, 100 GBE, and 200 GBE & 400 GBE segments based on the switching port technology. With a projected sales share of roughly 45.3% in 2025, the 100 GBE category leads the industry. The structure of networks must be able to manage massive amounts of data due to the need for high-speed data transmission and the exponential growth in data traffic. Greater speed and efficiency in data transfer are made possible by the 100 GBE technology's significant bandwidth capacity. Also, over time, the cost of 100 GBE per gigabyte of bandwidth has dropped, making it a competitive option for businesses.
Network Switches Market Regional Analysis
North America including technological centres and a growing IT sector that promotes the use of modern networking solutions, North America accounted for 37.4% of the global market share in 2025. Large companies and groups in industries like manufacturing, healthcare, and finance require dependable network infrastructure, which is why network switches are in higher demand. North America has been at the leading edge of several technical advancements, including the use of cloud computing and the Internet of Things. As a result, high-performance network switches are now even more required to handle the increasing volume of data flow.
Service providers in North America are upgrading their core networks, wireless backhaul service, aggregation, and access because of the growth of fixed internet traffic and the surge in mobile data traffic. Software-defined networking (SDN) and network functions virtualization (NFV) are growing more and more popular, which is driving up demand for software-based switches. The infrastructure has seen substantial investments from the government to promote the development of technology.
Network Switches Market Competitive Landscape
Several leading companies drive the global network switches industry and are well-established both locally and internationally. Several significant participants are committed to continuous research and development projects. Apart from that, they also actively participate in strategic growth activities like collaborations, joint ventures, and product launches. To gain a significant market share, these companies want to improve their standing in the marketplace and grow their customer base.
- On 5 March 2024, Arista Networks announced its new Cloud Vision Universal Network Observability (CV UNO) product, promising to deliver unified visibility across network, compute, and application layers.
- 13 March 2024 Broadcom Inc. the world’s leading provider of fiber optic components for optical networking and communications announced several major accomplishments extending its market leadership with an expanded portfolio of optical interconnect solutions for artificial intelligence (AI) and machine learning (ML) applications. Broadcom’s state-of-the-art optics technologies facilitate high-speed interconnects for front-end and back-end networks of large-scale generative AI compute clusters.
- April 2, 2024, Fortinet's Real-Time Network Security Operating System Help Businesses Strengthen Their Networks New generative AI, data protection, managed services, and unified agent features are provided by Security Fabric upgrades and the most recent version of FortiOS, the only operating system that seamlessly combines networking and security.
|
Network Switches Market Scope |
|
|
Market Size in 2025 |
USD 31.41 Bn. |
|
Market Size in 2032 |
USD 48.82 Bn. |
|
CAGR (2026-2032) |
6.5% |
|
Historic Data |
2020-2025 |
|
Base Year |
2025 |
|
Forecast Period |
2026-2032 |
|
Segment Scope |
By Type Fixed Configuration Switches Managed Switches Unmanaged Switches PoE Switches Modular Switches |
|
By Switching Port 100 MBE & 1 GBE 2.5 GBE & 5 GBE 10 GBE 25 GBE & 50 GBE 100 GBE 200 GBE & 400 GBE |
|
|
By End-user Servers and storage providers Telecommunication providers Enterprise and industrial usage |
|
|
Regional Scope |
North America- United States, Canada, and Mexico Europe – UK, France, Germany, Italy, Spain, Sweden, Austria, and Rest of Europe Asia Pacific – China, India, Japan, South Korea, Australia, ASEAN, Rest of APAC Middle East and Africa - South Africa, GCC, Egypt, Nigeria, Rest of the Middle East and Africa South America – Brazil, Argentina, Rest of South America |
Key Player in the Network Switches Market
North America:
- Broadcom Inc. - United States
- Fortinet Inc. – United States
- Arista Networks Inc. - United States
- Cisco Systems Inc. - United States
- Dell Technologies Inc. - United States
- Hewlett Packard Enterprise Co. - United States
- Juniper Networks Inc. - United States
- Netgear Inc. - United States
- Extreme Networks - United States
- Lantronix - United States
- NVIDIA Corporation - United States
- TRENDnet - United States
Asia-Pacific:
- ALE International - France
- Allied Telesis Holdings K.K. - Japan
- D Link Corp. - Taiwan
- DrayTek Corp. - Taiwan
- Fujitsu Ltd. - Japan
- Hikvision - China
- Huawei Technologies Co. Ltd. - China
- TP-Link - China
- Ruijie Networks - China
- Panasonic - Japan
Frequently Asked Questions
North America is expected to lead the Network Switches Market during the forecast period.
An analysis of profit trends and projections for companies in the Network Switches Market is included, offering insights into factors driving profitability, cost management strategies, and financial performance metrics.
The Network Switches Market size was valued at USD 31.41 Billion in 2025 and the total Network Switches Market size is expected to grow at a CAGR of 6.5% from 2026 to 2032, reaching nearly USD 48.82 Billion by 2032.
The segments covered in the market report are by Type, by Switching Port and by End-user.
1. Network Switches Market: Research Methodology
1.1. Research Data
1.1.1. Primary Data
1.1.2. Secondary Data
1.2. Market Size Estimation
1.2.1. Bottom-Up Approach
1.2.2. Top-Down Approach
1.3. Market Breakdown and Data Triangulation
1.4. Assumptions
2. Network Switches Market: Executive Summary
2.1. Market Overview
2.2. Market Size (2025) and Forecast (2026– 2032) and Y-O-Y%
2.3. Market Size (USD) and Market Share (%) – By Segments and Regions
3. Network Switches Market: Competitive Landscape
3.1. Stellar Competition Matrix
3.2. Key Players Benchmarking
3.2.1. Company Name
3.2.2. Headquarter
3.2.3. Product Segment
3.2.4. End-user Segment
3.2.5. Y-O-Y%
3.2.6. Revenue (2025)
3.2.7. Profit Margin
3.2.8. Market Share
3.2.9. Company Locations
3.3. Market Structure
3.3.1. Market Leaders
3.3.2. Market Followers
3.3.3. Emerging Players
3.4. Consolidation of the Market
3.4.1. Strategic Initiatives and Developments
3.4.2. Mergers and Acquisitions
3.4.3. Collaborations and Partnerships
3.4.4. Product Launches and Innovation
3.5. Network Switches Industry Ecosystem
3.5.1. Ecosystem Analysis
3.5.2. Role of the Companies in the Ecosystem
4. Network Switches Market: Dynamics
4.1. Market Trends by Region
4.1.1. North America
4.1.2. Europe
4.1.3. Asia Pacific
4.1.4. Middle East and Africa
4.1.5. South America
4.2. Market Drivers
4.3. Market Restraints
4.4. Market Opportunities
4.5. Market Challenges
4.6. PORTER’s Five Forces Analysis
4.6.1. Intensity of the Rivalry
4.6.2. Threat of New Entrants
4.6.3. Bargaining Power of Suppliers
4.6.4. Bargaining Power of Buyers
4.6.5. Threat of Substitutes
4.7. PESTLE Analysis
4.7.1. Political Factors
4.7.2. Economic Factors
4.7.3. Social Factors
4.7.4. Technological Factors
4.7.5. Legal Factors
4.7.6. Environmental Factors
4.8. Technological Roadmap
4.9. Value Chain Analysis
4.10. Regulatory Landscape
4.10.1. Market Regulation by Region
4.10.1.1. North America
4.10.1.2. Europe
4.10.1.3. Asia Pacific
4.10.1.4. Middle East and Africa
4.10.1.5. South America
4.10.2. Impact of Regulations on Market Dynamics
4.10.3. Government Schemes and Initiatives
5. Network Switches Market Size and Forecast by Segments (by Value USD Million)
5.1. Network Switches Market Size and Forecast, By Type (2025-2032)
5.1.1. Fixed Configuration Switches
5.1.2. Managed Switches
5.1.3. Unmanaged Switches
5.1.4. PoE Switches
5.1.5. Modular Switches
5.2. Network Switches Market Size and Forecast, By Switching Port (2025-2032)
5.2.1. 100 MBE & 1 GBE
5.2.2. 2.5 GBE & 5 GBE
5.2.3. 10 GBE
5.2.4. 25 GBE & 50 GBE
5.2.5. 100 GBE
5.2.6. 200 GBE & 400 GBE
5.3. Network Switches Market Size and Forecast, By End-User (2025-2032)
5.3.1. Servers and storage providers
5.3.2. Telecommunication providers
5.3.3. Enterprise and industrial usage
5.4. Network Switches Market Size and Forecast, by Region (2025-2032)
5.4.1. North America
5.4.2. Europe
5.4.3. Asia Pacific
5.4.4. Middle East and Africa
5.4.5. South America
6. North America Network Switches Market Size and Forecast (by Value USD Million)
6.1. North America Network Switches Market Size and Forecast, By Type (2025-2032)
6.1.1. Fixed Configuration Switches
6.1.2. Managed Switches
6.1.3. Unmanaged Switches
6.1.4. PoE Switches
6.1.5. Modular Switches
6.2. North America Network Switches Market Size and Forecast, By Switching Port (2025-2032)
6.2.1. 100 MBE & 1 GBE
6.2.2. 2.5 GBE & 5 GBE
6.2.3. 10 GBE
6.2.4. 25 GBE & 50 GBE
6.2.5. 100 GBE
6.2.6. 200 GBE & 400 GBE
6.3. North America Network Switches Market Size and Forecast, By End-User (2025-2032)
6.3.1. Servers and storage providers
6.3.2. Telecommunication providers
6.3.3. Enterprise and industrial usage
6.4. North America Network Switches Market Size and Forecast, by Country (2025-2032)
6.4.1. United States
6.4.2. Canada
6.4.3. Mexico
7. Europe Network Switches Market Size and Forecast (by Value USD Million)
7.1. Europe Network Switches Market Size and Forecast, By Type (2025-2032)
7.2. Europe Network Switches Market Size and Forecast, By Switching Port (2025-2032)
7.3. Europe Network Switches Market Size and Forecast, By End-User (2025-2032)
7.4. Europe Network Switches Market Size and Forecast, by Country (2025-2032)
7.4.1. UK
7.4.2. France
7.4.3. Germany
7.4.4. Italy
7.4.5. Spain
7.4.6. Sweden
7.4.7. Austria
7.4.8. Rest of Europe
8. Asia Pacific Network Switches Market Size and Forecast (by Value USD Million)
8.1. Asia Pacific Network Switches Market Size and Forecast, By Type (2025-2032)
8.2. Asia Pacific Network Switches Market Size and Forecast, By Switching Port (2025-2032)
8.3. Asia Pacific Network Switches Market Size and Forecast, By End-User (2025-2032)
8.4. Asia Pacific Network Switches Market Size and Forecast, by Country (2025-2032)
8.4.1. China
8.4.2. S Korea
8.4.3. Japan
8.4.4. India
8.4.5. Australia
8.4.6. Indonesia
8.4.7. Malaysia
8.4.8. Vietnam
8.4.9. Taiwan
8.4.10. Bangladesh
8.4.11. Pakistan
8.4.12. Rest of Asia Pacific
9. Middle East and Africa Network Switches Market Size and Forecast (by Value USD Million)
9.1. Middle East and Africa Network Switches Market Size and Forecast, By Type (2025-2032)
9.2. Middle East and Africa Network Switches Market Size and Forecast, By Switching Port (2025-2032)
9.3. Middle East and Africa Network Switches Market Size and Forecast, By End-User (2025-2032)
9.4. Middle East and Africa Network Switches Market Size and Forecast, by Country (2025-2032)
9.4.1. South Africa
9.4.2. GCC
9.4.3. Egypt
9.4.4. Nigeria
9.4.5. Rest of ME&A
10. South America Network Switches Market Size and Forecast (by Value USD Million)
10.1. South America Network Switches Market Size and Forecast, By Type (2025-2032)
10.2. South America Network Switches Market Size and Forecast, By Switching Port (2025-2032)
10.3. South America Network Switches Market Size and Forecast, By End-User (2025-2032)
10.4. South America Network Switches Market Size and Forecast, by Country (2025-2032)
10.4.1. Brazil
10.4.2. Argentina
10.4.3. Rest of South America
11. Company Profile: Key players
11.1. Broadcom Inc. - United States
11.1.1. Company Overview
11.1.2. Product Portfolio
11.1.2.1. Product Name
11.1.2.2. Product Details (Price, Features, etc.)
11.1.3. Financial Overview
11.1.3.1. Total Revenue
11.1.3.2. Segment Revenue
11.1.3.3. Regional Revenue
11.1.4. SWOT Analysis
11.1.5. Strategic Analysis
11.1.6. Recent Developments
11.2. Fortinet Inc. – United States
11.3. Arista Networks Inc. - United States
11.4. Cisco Systems Inc. - United States
11.5. Dell Technologies Inc. - United States
11.6. Hewlett Packard Enterprise Co. - United States
11.7. Juniper Networks Inc. - United States
11.8. Netgear Inc. - United States
11.9. Extreme Networks - United States
11.10. Lantronix - United States
11.11. NVIDIA Corporation - United States
11.12. TRENDnet - United States
11.13. ALE International - France
11.14. Allied Telesis Holdings K.K. - Japan
11.15. D Link Corp. - Taiwan
11.16. DrayTek Corp. - Taiwan
11.17. Fujitsu Ltd. - Japan
11.18. Hikvision - China
11.19. Huawei Technologies Co. Ltd. - China
11.20. TP-Link - China
11.21. Ruijie Networks - China
11.22. Panasonic - Japan
12. Key Findings
13. Industry Recommendations
13.1. Strategic Recommendations
13.2. Future Outlook