Waste to Energy Market Global Industry Analysis and Forecast (2026-2032) by Service, Delivery Model and End-User
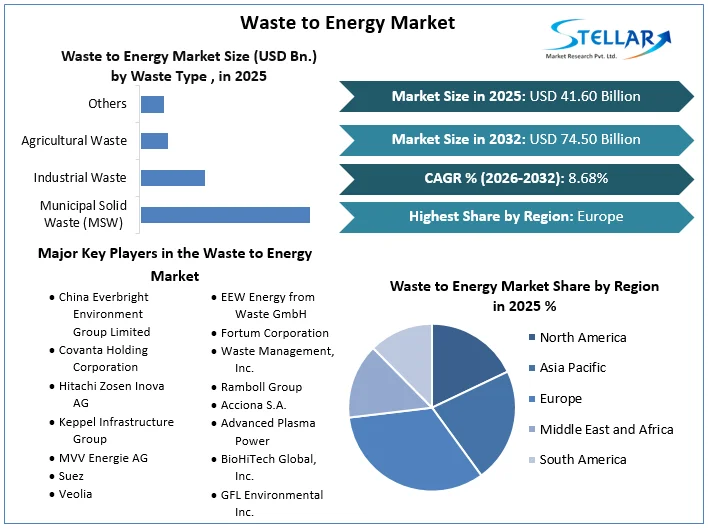
The Waste to Energy Market size was valued at USD 41.60 Bn. in 2025 and the total Global Waste to Energy Market revenue is expected to grow at a CAGR of 8.68% from 2026 to 2032, reaching nearly USD 74.50 Bn.
Waste to Energy Market Overview
The process known as "waste-to-energy" (WtE) transforms non-recyclable garbage into energy that is used to produce heat or power. Along with being an essential part of a circular economy, it is a renewable energy source that keeps garbage out of landfills. WtE plants normally consume metropolitan and modern strong waste to deliver steam, which then controls an electric generator turbine, creating power. This interaction diminishes the volume of waste as well as recuperates significant assets like metals from the waste stream.
The Waste to Energy has seen tremendous growth with a 38.28 Bn market size for the year 2025 and is expected to grow at a CAGR of 8.68% in the projected period. This growth is attributed to several factors such as Urban Population Growth and Waste Generation, Focus on Non-Fossil Fuel Sources of Energy, Technological Advances, and Regional Initiatives. The major drivers for the Waste to Energy market include increasing demand for renewable energy and Environmental regulations and concerns. Though the Waste to Energy market is expected to grow significantly, some of the major restraining factors that hamper the growth include Regulatory Hurdles, Public Acceptance, Availability of Alternative Waste Management Methods, and the Complex Nature of Waste Composition. The Waste to Energy market is segmented by Technology and Waste type.
The Regional segmentation of the Waste to Energy Market consists of North America, APAC, Europe, South America, and the Middle East. The European region dominated the Waste to Energy Market by occupying a substantial share of 43.8% in 2025. The dominance is majorly attributed to the strict environmental regulations, limited landfill space, and a strong focus on renewable energy generation. Europe is followed by North America for holding the second-largest share in the Waste to Energy Market, primarily because of increasing awareness of climate change and environmental protection. The APAC region, however, is expected to grow significantly due to rapid industrialization, urbanization, and rising population in nations like India and China.
The Waste to Energy Market in APAC is witnessing joint efforts between waste management companies, technology providers, and energy firms to leverage strengths and grow their market presence. Some of the key players dominating the Waste to Energy market include-China Everbright Environment Group Limited, Covanta Holding Corporation, Hitachi Zosen Inova AG, Keppel Infrastructure Group, MVV Energie AG, Suez, Veolia, Viridor Limited, Wheelabrator Technologies Inc., EEW Energy from Waste GmbH, Fortum Corporation, Waste Management, Inc., Ramboll Group, Acciona S.A., Advanced Plasma Power, BioHiTech Global, Inc., GFL Environmental Inc., Herz GmbH, KEPPEL SEGHERS.
To get more Insights: Request Free Sample Report
Waste to Energy Market Dynamics
Drivers
Increased Demand for Renewable Energy- The prolonged interest in sustainable power is a huge driving variable for the Waste to Energy (WtE) market. This demand originates from an uplifted accentuation on using elective energy sources to diminish reliance on fossil fuels and moderate ozone-depleting substance emanations. The increase in demand for sustainable power and the shift towards low-carbon economies have sped up the reception of waste-to-energy advances. For instance in India due to the increase in demand, the Renewable energy shares increased in all four demand sectors in 2020, to reach 16.8% of energy consumption in industry, 15.5% each in buildings and agriculture, and 4.1% in transport. Moreover, Waste to-energy plants play a critical part in diminishing harmful emissions by recuperating assets, staying away from methane outflows from landfills, and balancing fossil fuel byproducts from petroleum derivative power age.
Environmental Regulations and Concerns- Environmental Regulations and concerns play a vital part in driving the Waste to Energy (WtE) market. Severe environmental regulations and public emphasis on maintainability have provoked legislatures overall to execute measures pointed toward overseeing waste proficiently and lessening contamination. These guidelines are vital in advancing the treatment of Waste to Energy innovations as they give an economical answer for waste management and energy creation while decreasing ozone-depleting substance outflows. For instance, in-
United States- Landfills in the U.S. are expected by guidelines under the Clean Air Act to introduce and work landfill gas assortment frameworks, which gathered around 256 billion cubic feet of landfill gas in 2020 for energy generation.
India- the Indian government boosts WtE projects through capital endowments and feed-in tariffs, effectively supporting innovation answers for energy recovery from municipal and industrial waste.
Europe- European nations like Sweden, Denmark, and Germany have tough ecological guidelines that have sped up the treatment of Waste to Energy arrangements, lining up with aggressive sustainability objectives set by the European Union.
These guidelines establish a positive climate for Waste to-energy projects by giving clear rules, streamlining permitting processes, and drawing in confidential interests into maintainable waste administration arrangements. By lining up with these guidelines, WtE advances contribute essentially to decreasing the ecological effect of garbage removal while reasonably creating clean energy.
Technological Advances-Technological advances in Waste to Energy (WtE) technologies have greatly enhanced the efficiency and effectiveness of waste treatment, contributing to the overall growth of the WtE market.
- Technological Advances- The overall expansion of the Waste to Energy (WtE) market attributed to technological advancements in WtE technologies that have significantly improved the effectiveness and efficiency of waste treatment. Some of the Waste to Energy technologies include-
- Thermal-based WtE- In 2023, thermal-based WtE technologies, such as mass-burn combustion facilities, accounted for approximately 80% of the market's total revenue.
- Dendro Liquid Energy (DLE) - DLE is considered 4X more efficient in generating electricity compared to anaerobic digestion (AD).
- Hydrothermal Carbonization (HTC)- HTC is explicitly intended for changing wet biomass feedstock, offering lower handling times and comparable energy yield qualities as petroleum derivatives
- Advanced Incineration Systems- Technological advancements in incineration have decreased maintenance and operating costs while increasing operational efficiency.
Restraints faced by the Waste to Energy Market
High Capital Investment- the Waste to Energy (WtE) market's growth is hampered by the market's high capital investment requirements. This major restraint includes the expense of purchasing equipment, designing infrastructure, and obtaining necessary permits and approvals. Constructing and working WtE offices requires huge capital venture, which prevent small entities from entering the Waste to Energy market and cut the overall development of the market. As of 2022, the worldwide Waste to Energy market arrived at a worth of USD 32.41 billion, however, the development costs for large-scale Waste to Energy offices go from many millions to billions of dollars. For example, the Energiewerk Schwarze Pumpe plant in Germany had an underlying venture of €1.2 billion (USD 1.3 billion).
Legal and Administrative Hurdles- Another major hurdle that hinders the growth of the Waste to Energy market is the Legal and Administrative Hurdles. Several circumstances act as a barrier like difficulties in obtaining planning permission for Waste to Energy projects affect the overall development. Local planning authorities or government bodies present difficulties in allowing endorsements for the development of WtE facilities. Another such factor includes choosing how to divide incomes between partners a complex legitimate issue in Waste to Energy projects. Guaranteeing fair income dissemination and tending to partner concerns are vital viewpoints that make lawful obstacles. Private-sector participants in Waste to Energy projects face authoritative and business challenges, for example, Negotiating agreements, characterizing liabilities, and guaranteeing monetary suitability.
These difficulties affect the effective execution of Waste to Energy projects. Also, severe natural guidelines apply to emanations from WtE plants, requiring the establishment of cutting-edge gas cleaning frameworks. Meeting these administrative prerequisites while exploring legitimate systems really difficult for WtE administrators.
Waste to Energy Market Segmentation
By Technology, The waste-to-energy market is segmented based on technology, with thermal, biochemical, and other technologies being key segments. Thermal technology dominated the Waste to Energy Market by technology holding approximately 80% of the total market share. Within the thermal segment, incineration technology was the major revenue contributor. The ease of operations and the simple process of energy generation have led to significant growth in this segment. On the other hand, Biological technology is also a major contributor to the Waste to energy market, it involves the fermentation of waste materials to produce biogas. Lastly, Physical technology involves the use of mechanical processes to convert waste into energy, such as through incineration or landfill gas recovery.

By Waste Type, Municipal Solid Waste (MSW) is the largest waste type segment in the waste to energy market, contributing a significant piece of the market's income. The MSW segment accounted for USD 37.1 billion in 2022. And MSW is expected to continue dominating the market share. The agricultural waste segment is estimated to grow at a steady pace during the forecast period. The "others" segment includes waste types such as medical waste, construction waste, and hazardous waste.
Competitive Landscape for the Waste to Energy
The competitive landscape of the waste to energy market is characterized by the presence of both global and regional players. The market is highly fragmented, with several players including Babcock & Wilcox Enterprises, Inc., China Everbright Environment Group Limited, Covanta Holding Corporation, Hitachi Zosen Inova AG, Keppel Infrastructure Group, MVV Energie AG, Suez, Veolia, Viridor Limited, Wheelabrator Technologies Inc., EEW Energy from Waste GmbH, Fortum Corporation, Waste Management, Inc., Ramboll Group, Acciona S.A., Advanced Plasma Power, BioHiTech Global, Inc., GFL Environmental Inc., Herz GmbH, KEPPEL SEGHERS. These organizations contend because of elements like innovation advancement, project capacities, functional productivity, and geographic reach. The market is seeing joint efforts and organizations between Waste management companies, Technology suppliers, and energy firms to use each other's assets and extend their market presence.
China Everbright Environment Group Limited- China Everbright Environment Group Limited is a major player in the waste-to-energy industry, having invested heavily in several environmental initiatives. The group had secured and invested in 578 environmental protection projects as of June 30, 2023, totaling an investment of around RMB 158.044 billion. Among the projects that fall under this category are waste-to-energy, fly ash, food and kitchen waste treatment, leachate, methane-to-energy, sludge treatment, and disposal.
GFL Environmental Inc. - On November 6, 2023, GFL Environmental acquired Capital Waste Services, a Columbia, South Carolina-based waste services firm. In May 2022, GFL Environmental acquired Sprint Waste Services, a vertically integrated network of solid waste assets across 14 sites in Texas and two sites in Louisiana. Also, In November 2023, GFL Environmental acquired Fielding Environmental, a fully integrated environmental solutions provider specializing in liquid waste and gas processing, recycling, and disposal.
Fortum Corporation- In January 2024, Fortum prepared a Green Finance Framework to finance future potential investments in clean energy.
|
Waste to Energy Market Scope |
|
|
Market Size in 2025 |
USD 41.60 Bn |
|
Market Size in 2032 |
USD 74.50 Bn |
|
CAGR (2026-2032) |
8.68% |
|
Historic Data |
2020-2025 |
|
Base Year |
2025 |
|
Forecast Period |
2026-2032 |
|
Segment Scope |
By Technology
|
|
By Waste Type
|
|
|
Regional Scope |
North America- United States, Canada, and Mexico Europe – UK, France, Germany, Italy, Spain, Sweden, Austria, and Rest of Europe Asia Pacific – China, India, Japan, South Korea, Australia, ASEAN, Rest of APAC Middle East and Africa - South Africa, GCC, Egypt, Nigeria, Rest of the Middle East and Africa South America – Brazil, Argentina, Rest of South America |
Waste to Energy Market Key Players
- China Everbright Environment Group Limited
- Covanta Holding Corporation
- Hitachi Zosen Inova AG
- Keppel Infrastructure Group
- MVV Energie AG
- Suez
- Veolia
- Viridor Limited
- Wheelabrator Technologies Inc.
- EEW Energy from Waste GmbH
- Fortum Corporation
- Waste Management, Inc.
- Ramboll Group
- Acciona S.A.
- Advanced Plasma Power
- BioHiTech Global, Inc.
- GFL Environmental Inc.
- Herz GmbH
- KEPPEL SEGHERS
Frequently Asked Questions
There are 3 major Waste types in Waste to Energy Market, namely; Municipal Solid Waste (MSW), Industrial Waste and Agricultural Waste.
Include China Everbright Environment Group Limited, Covanta Holding Corporation, Hitachi Zosen Inova AG, Keppel Infrastructure Group, MVV Energie AG, Suez, Veolia, Viridor Limited, Wheelabrator Technologies Inc., EEW Energy from Waste GmbH, Fortum Corporation, Waste Management, Inc., Ramboll Group, Acciona S.A., Advanced Plasma Power, BioHiTech Global, Inc., GFL Environmental Inc., Herz GmbH, KEPPEL SEGHERS.
Europe holds the largest market share in the Waste to Energy Market.
8.68% CAGR is the growth rate of the Waste to Energy Market.
1. Waste to Energy Market: Research Methodology
1.1. Research Data
1.1.1. Primary Data
1.1.2. Secondary Data
1.2. Market Size Estimation
1.2.1. Bottom-Up Approach
1.2.2. Top-Down Approach
1.3. Market Breakdown and Data Triangulation
1.4. Assumptions
2. Waste to Energy Market: Executive Summary
2.1. Market Overview
2.2. Market Size (2025) and Forecast (2026– 2032) and Y-O-Y%
2.3. Market Size (USD) and Market Share (%) – By Segments and Regions
3. Waste to Energy Market: Competitive Landscape
3.1. Stellar Competition Matrix
3.2. Key Players Benchmarking
3.2.1. Company Name
3.2.2. Headquarter
3.2.3. Business Segment
3.2.4. End-user Segment
3.2.5. Y-O-Y%
3.2.6. Revenue (2025)
3.2.7. Profit Margin
3.2.8. Market Share
3.2.9. Company Locations
3.3. Market Structure
3.3.1. Market Leaders
3.3.2. Market Followers
3.3.3. Emerging Players
3.4. Consolidation of the Market
3.4.1. Strategic Initiatives
3.4.2. Mergers and Acquisitions
3.4.3. Collaborations and Partnerships
3.4.4. Developments and Innovations
4. Waste to Energy Market: Dynamics
4.1. Market Trends by Region
4.1.1. North America
4.1.2. Europe
4.1.3. Asia Pacific
4.1.4. Middle East and Africa
4.1.5. South America
4.2. Market Drivers
4.3. Market Restraints
4.4. Market Opportunities
4.5. Market Challenges
4.6. PORTER’s Five Forces Analysis
4.6.1. Intensity of the Rivalry
4.6.2. Threat of New Entrants
4.6.3. Bargaining Power of Suppliers
4.6.4. Bargaining Power of Buyers
4.6.5. Threat of Substitutes
4.7. PESTLE Analysis
4.7.1. Political Factors
4.7.2. Economic Factors
4.7.3. Social Factors
4.7.4. Technological Factors
4.7.5. Legal Factors
4.7.6. Environmental Factors
4.8. Technological Roadmap
4.9. Regulatory Landscape
4.9.1. Market Regulation by Region
4.9.1.1. North America
4.9.1.2. Europe
4.9.1.3. Asia Pacific
4.9.1.4. Middle East and Africa
4.9.1.5. South America
4.9.2. Impact of Regulations on Market Dynamics
4.9.3. Government Schemes and Initiatives
5. Waste to Energy Market Size and Forecast by Segments (by Value USD Million)
5.1. Waste to Energy Market Size and Forecast, By Technology (2025-2032)
5.1.1. Thermal
5.1.2. Biological
5.1.3. Physical
5.2. Waste to Energy Market Size and Forecast, By Waste Type (2025-2032)
5.2.1. Municipal Solid Waste (MSW)
5.2.2. Industrial Waste
5.2.3. Agricultural Waste
5.2.4. Others
5.3. Waste to Energy Market Size and Forecast, by Region (2025-2032)
5.3.1. North America
5.3.2. Europe
5.3.3. Asia Pacific
5.3.4. Middle East and Africa
5.3.5. South America
6. North America Waste to Energy Market Size and Forecast (by Value USD Million)
6.1. North America Waste to Energy Market Size and Forecast, By Technology (2025-2032)
6.1.1. Thermal
6.1.2. Biological
6.1.3. Physical
6.2. North America Waste to Energy Market Size and Forecast, By Waste Type (2025-2032)
6.2.1. Municipal Solid Waste (MSW)
6.2.2. Industrial Waste
6.2.3. Agricultural Waste
6.2.4. Others
6.3. North America Waste to Energy Market Size and Forecast, by Country (2025-2032)
6.3.1. United States
6.3.2. Canada
6.3.3. Mexico
7. Europe Waste to Energy Market Size and Forecast (by Value USD Million)
7.1. Europe Waste to Energy Market Size and Forecast, By Technology (2025-2032)
7.2. Europe Waste to Energy Market Size and Forecast, By Waste Type (2025-2032)
7.3. Europe Waste to Energy Market Size and Forecast, by Country (2025-2032)
7.3.1. UK
7.3.2. France
7.3.3. Germany
7.3.4. Italy
7.3.5. Spain
7.3.6. Sweden
7.3.7. Austria
7.3.8. Rest of Europe
8. Asia Pacific Waste to Energy Market Size and Forecast (by Value USD Million)
8.1. Asia Pacific Waste to Energy Market Size and Forecast, By Technology (2025-2032)
8.2. Asia Pacific Waste to Energy Market Size and Forecast, By Waste Type (2025-2032)
8.3. Asia Pacific Waste to Energy Market Size and Forecast, by Country (2025-2032)
8.3.1. China
8.3.2. S Korea
8.3.3. Japan
8.3.4. India
8.3.5. Australia
8.3.6. Indonesia
8.3.7. Malaysia
8.3.8. Vietnam
8.3.9. Taiwan
8.3.10. Bangladesh
8.3.11. Pakistan
8.3.12. Rest of Asia Pacific
9. Middle East and Africa Waste to Energy Market Size and Forecast (by Value USD Million)
9.1. Middle East and Africa Waste to Energy Market Size and Forecast, By Technology (2025-2032)
9.2. Middle East and Africa Waste to Energy Market Size and Forecast, By Waste Type (2025-2032)
9.3. Middle East and Africa Waste to Energy Market Size and Forecast, by Country (2025-2032)
9.3.1. South Africa
9.3.2. GCC
9.3.3. Egypt
9.3.4. Nigeria
9.3.5. Rest of ME&A
10. South America Waste to Energy Market Size and Forecast (by Value USD Million)
10.1. South America Waste to Energy Market Size and Forecast, By Technology (2025-2032)
10.2. South America Waste to Energy Market Size and Forecast, By Waste Type (2025-2032)
10.3. South America Waste to Energy Market Size and Forecast, by Country (2025-2032)
10.3.1. Brazil
10.3.2. Argentina
10.3.3. Rest of South America
11. Company Profile: Key players
11.1. China Everbright Environment Group Limited
11.1.1. Company Overview
11.1.2. Business Portfolio
11.1.3. Financial Overview
11.1.3.1. Total Revenue
11.1.3.2. Segment Revenue
11.1.3.3. Regional Revenue
11.1.4. SWOT Analysis
11.1.5. Strategic Analysis
11.1.6. Recent Developments
11.2. Covanta Holding Corporation
11.3. Hitachi Zosen Inova AG
11.4. Keppel Infrastructure Group
11.5. MVV Energie AG
11.6. Suez
11.7. Veolia
11.8. Viridor Limited
11.9. Wheelabrator Technologies Inc.
11.10. EEW Energy from Waste GmbH
11.11. Fortum Corporation
11.12. Waste Management, Inc.
11.13. Ramboll Group
11.14. Acciona S.A.
11.15. Advanced Plasma Power
11.16. BioHiTech Global, Inc.
11.17. GFL Environmental Inc.
11.18. Herz GmbH
11.19. KEPPEL SEGHERS
12. Key Findings
13. Industry Recommendations
13.1. Strategic Recommendations
13.2. Future Outlook