North America Agriculture Variable Rate Technology Market- Industry Analysis and Forecast (2025-2032)
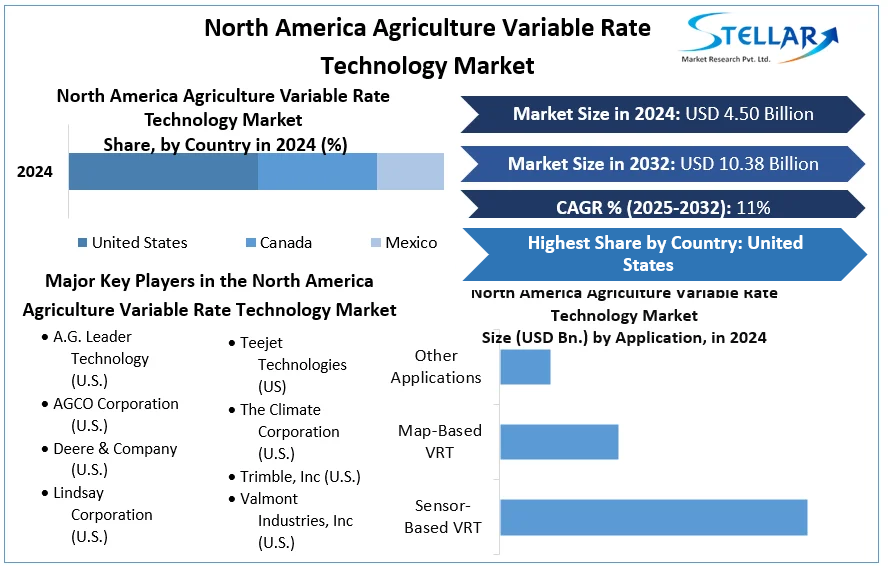
North America Agriculture Variable Rate Technology Market was valued at USD 4.50 billion and was expected to grow at a CAGR of 11% during the forecasting period (2025-2032)
North America Agriculture Variable Rate Technology Market Overview:
The COVID-19 epidemic not only sparked a new form of farming crisis but also struck at a terrible period for American farmers. In most years over the last few years, commodity output has surpassed demand, resulting in lower prices. Global commodities supply has generally exceeded demand since the unprecedented 2012 U.S. drought and peak commodity prices in 2013, fueling sustained price decreases. Producer prices for corn decreased 48 percent from $6.89 per bushel to $3.56 per bushel between 2012 and 2019, and producer prices for soybeans fell 40% - nearly six dollars per bushel.
To get more Insights: Request Free Sample Report
North America Agriculture Variable Rate Technology Market Dynamics:
Robotics, temperature and moisture sensors, aerial pictures, and GPS technology are all used often in agriculture today. Businesses are more profitable, productive, safer, and environmentally friendly thanks to contemporary technology, precision agriculture, and robotic systems.
Robotic technologies enable more reliable monitoring along with the management of natural resources, such as air and water quality. Thanks to modern technology, precision agriculture, and robotic systems, businesses are more profitable, productive, safer, and environmentally friendly.
More reliable monitoring and management of natural resources, such as air and water quality, is possible thanks to robotic technologies. It also provides farmers more control over the processing, transport, production, and storage of plants and animals, resulting in:
- Lower pricing and more efficiencies
- Safer Agricultural conditions
- Decreased environmental hazards.
In many cases, current IoT technologies operating on 3G and 4G cellular networks are sufficient to provide more straightforward use cases, such as sophisticated crop and livestock monitoring. However, because hardware costs were high in the past, the business case for deploying IoT in farming did not hold up. Device and hardware costs are falling rapidly these days, and numerous companies now provide solutions at a price that we feel will pay off in the first year.
The North American agricultural machinery market is expected to grow at a 7.79% CAGR during the forecast period. Further, the labor shortage in agriculture in North America prompts increased usage of technologies and modern machinery, thus driving the North American Agriculture variable rate technology market. In 2018, the agriculture business, for example, had a 7% decrease in hired labor and a 5% increase in labor wages.
Government Initiatives:
Governments have used various strategies to keep agricultural prices, and earnings higher than they would have been in the market had the government not intervened. Tariffs or import levies, import quotas, export subsidies, direct payments to farmers, and production limits have been employed. Taxes and import quotas are only effective if a country imports a portion of its supply regularly. Export subsidies cause domestic consumers to pay higher prices than international buyers; their use requires import controls to prevent foreign goods from entering the domestic market and lowering costs. Direct payments to farmers are made to keep consumer prices stable while ensuring a higher return than the world market.
Food security for everybody, including access to safe and healthy food, is a priority for the government. They are making agriculture and food more climate-smart: more productive and resilient in the face of climate change while lowering greenhouse gas emissions. New IBRD/IDA commitments to agriculture and allied sectors totaled $6.7 billion in 2021, with 157 projects assisting 9.7 million farmers with agricultural assets and services and 1.3 million farmers adopting enhanced agrarian technologies. Climate action was directly supported by about $3 billion in food and agriculture finance.
USDA agencies have done an excellent job of meeting the needs of specific stakeholders and customers. Regular communication, collaboration, and partnerships among players in the innovation ecosystem help ensure the development of shared goals, identifying new and emerging targets and opportunities, and accountability for American agriculture's future success in delivering a safe, secure, abundant, and nutritious food supply.
North America Agriculture Variable Rate Technology Market Overview Market Segmentation:
The NorthAmerica Agriculture Variable Rate Technology market is segmented by product type, application, Services, Crop Type, farm type, and geographical region in this report. The Agriculture Variable Rate Technology market by Product type is segmented into Soil Sensing, Fertilizer VRT, Crop Protection Chemical VRT, Seeding VRT, Yield Monitoring, Irrigation VRT, and Others.
VRS (variable-rate seeding) is an intelligent agriculture method that can modify the seeding rate in response to changes in soil qualities, geography, climatic conditions, and other factors. VRS not only improves the use of variable soil nutrient and water storage capacity characteristics but also reduces seed consumption, increasing crop yields. VRS is a technique for tying seed quantity to a specific location, resulting in higher crop yields and revenues. VRS is a way of tying seed quantities to a specific location, hence enhancing agricultural yields and production profitability because seed germination, crop growth, and yield potential vary by field region.
VRT is the only one of the four precision technologies that are commonly used in conjunction with others. When used with different mapping methods, VRT is seen to be complementary to mapping and may result in varied cost savings. VRT-capable agricultural input application equipment, for example, can be programmed by farmers using yield maps or soil maps to apply different levels of inputs, including seeds, at varied rates within a field.
Corn producers who used yield mapping alone or in combination with VRT saved the most money (approximately $25 per acre) among those who used these four precision agriculture technology. Thus cereals and grains are expected to dominate the crop type segment during the forecast period. Yield monitors capture data on growing conditions reflected in yields throughout the year, and yield variability across a farmer's field provides a wealth of information on the efficacy of current methods. Because each data point on a soil map necessitates an individual geo-located soil test, farmers employing soil mapping with GPS saved over $13 per acre, less than half the cost of yield mapping.
North America Agriculture Variable Rate Technology Market Regional Analysis
The report contains an in-depth analysis of the North America Agriculture Variable Rate Technology market by geographical region across Asia-Pacific. The presence of developed countries like USA and Canada is expected to drive the North America Agriculture Variable Rate Technology market growth in this region. Food spending ranked third among the average U.S. household's expenditures in 2024, with 11.9%, behind housing (34.9%) and transportation (16%). Agriculture and agri-food have a significant role in the Canadian economy.
Agriculture and Agri-Food Canada is responsible for supporting primary agriculture (farmers) and food and beverage processing. Still, the sector also encompasses the more extensive agri-food system, impacting other industries along the food supply chain. Canada's food system is resilient and inventive, and it helps protect the environment and the economy. The entire agriculture and agri-food system in 2021: employed 2.1 million people, accounting for one out of every nine employment in Canada, and contributed $139.3 billion (about 7.4%) of the country's gross domestic output (GDP).
This report aims to analyze current market trends and potential opportunities to enhance growth to succeed in the industry. The report identifies factors influencing market dynamics and development of the North America Agriculture Variable Rate Technology market and how this will control investment during the forecasting period. The report studies regional markets to provide valuable insights into revenue and predicted value; information also includes the competitive landscape of key industry players and their recent developments.
Through comprehensive research supported by qualitative and quantitative data, this report provides essential information on the market behavior during the projection period (2025-2032). It also recognizes dominant segments in the market, projects their development, and identifies new elements that will dominate with technological advancements.
The report contains detailed analyses through Porter's five forces model to determine the industry's structure and help devise a corporate strategy for the market. The model reports provide essential information about stakeholders' influence, product quality, substitute products, etc. The report also analyses whether the North America Agriculture Variable Rate Technology market is accessible for new competitors to gain a foothold, whether they enter or exit the market regularly, and if a few players dominate it.
A measured approach is adopted through Pestel analysis to quantify factors including government policies, economic structure, and political situations that will affect the development of this sector. Economic variables aid in studying financial performance drivers that impact the North America Agriculture Variable Rate, and Technology Market. The report also considers environmental and legal factors that may affect the progress in this industry.
North America Agriculture Variable Rate Technology Market Scope:
|
North America Agriculture Variable Rate Technology Market |
|
|
Market Size in 2024 |
USD 4.50 Bn. |
|
Market Size in 2032 |
USD 10.38 Bn. |
|
CAGR (2025-2032) |
11% |
|
Historic Data |
2019-2024 |
|
Base Year |
2024 |
|
Forecast Period |
2025-2032 |
|
Segment Scope |
Product Type
|
|
By Application
|
|
|
By Services
|
|
|
By Crop Type
|
|
|
By Farm Type
|
|
|
Country Scope |
United States Canada Mexico |
North America Agriculture Variable Rate Technology Major Competitors:
The North America Agriculture Variable Rate Technology demands innovation and progress in a continuously changing landscape with new government policies and development. Thus, significant players often opt for strategies to invest in research and more recent technologies to be market-ready. Details profiles about the competitors, including revenue, market size, analysis, and technological advancements, are covered in this report.
- A.G. Leader Technology (U.S.)
- AGCO Corporation (U.S.)
- Deere & Company (U.S.)
- Lindsay Corporation (U.S.)
- Teejet Technologies (US)
- The Climate Corporation (U.S.)
- Trimble, Inc (U.S.)
- Valmont Industries, Inc (U.S.)
Frequently Asked Questions
USA is projected to multiply and acquire a major share in the forecasting period.
North America Agriculture Variable Rate Technology market is expected to grow at a CAGR of 11.83% during the forecasting period.
Trimble, Inc (U.S.), Valmont Industries, Inc (U.S.), Teejet Technologies (U.S.), The Climate Corporation (U.S.) are the major players.
1. North America Agriculture Variable Rate Technology Market: Research Methodology
1.1 Research Data
1.1.1. Primary Data
1.1.2. Secondary Data
1.2. Market Size Estimation
1.2.1. Bottom-Up Approach
1.2.2. Top-Up Approach
1.3. Market Breakdown and Data Triangulation
1.4. Research Assumption
2. North America Agriculture Variable Rate Technology Executive Summary
2.1. Market Overview
2.2. Market Size (2024) and Forecast (2025 – 2032) and Y-O-Y%
2.3. Market Size (USD) and Market Share (%) – By Segments
3. North America Agriculture Variable Rate Technology Market: Competitive Landscape
3.1. SMR Competition Matrix
3.2. Key Players Benchmarking
3.2.1. Company Name
3.2.2. Headquarter
3.2.3. Product Segment
3.2.4. End-user Segment
3.2.5. Y-O-Y%
3.2.6. Revenue (2024)
3.2.7. Market Share
3.2.8. Company Locations
3.3. Market Structure
3.3.1. Market Leaders
3.3.2. Market Followers
3.3.3. Emerging Players
3.4. Consolidation of the Market
4. North America Agriculture Variable Rate Technology Market: Dynamics
4.1. North America Agriculture Variable Rate Technology Market Trends
4.2. North America Agriculture Variable Rate Technology Market Drivers
4.3. North America Agriculture Variable Rate Technology Market Restraints
4.4. North America Agriculture Variable Rate Technology Market Opportunities
4.5. North America Agriculture Variable Rate Technology Market Challenges
4.6. PORTER’s Five Forces Analysis
4.7. PESTLE Analysis
4.8. Value Chain Analysis
4.9. Technological Roadmap
4.10. Regulatory Landscape
5. North America Agriculture Variable Rate Technology Market: Market Size and Forecast by Segmentation (by Value in USD Million) (2024-2032)
5.1. North America Agriculture Variable Rate Technology Market Size and Forecast, by Product Type (2024-2032)
5.1.1. Soil Sensing
5.1.2. Fertilizer VRT
5.1.3. Crop Protection Chemical VRT
5.1.4. Seeding VRT
5.1.5. Yield Monitoring
5.1.6. Irrigation VRT
5.1.7. And Others
5.2. North America Agriculture Variable Rate Technology Market Size and Forecast, by Application (2024-2032)
5.2.1. Sensor-Based VRT
5.2.2. Map-Based VRT
5.2.3. Other Applications
5.3. North America Agriculture Variable Rate Technology Market Size and Forecast, by Services (2024-2032)
5.3.1. Hardware
5.3.2. Software
5.3.3. Other Services
5.4. North America Agriculture Variable Rate Technology Market Size and Forecast, by Crop Type (2024-2032)
5.4.1. Cereals and Grains
5.4.2. Oilseeds and Pulses
5.4.3. Fruits and Vegetables
5.5. North America Agriculture Variable Rate Technology Market Size and Forecast, by Farm Type (2024-2032)
5.5.1. Small
5.5.2. Medium
5.5.3. Large
5.6. North America Agriculture Variable Rate Technology Market Size and Forecast, by Country (2024-2032)
5.6.1. United States
5.6.2. Canada
5.6.3. Mexico
6. Company Profile: Key Players
6.1. A.G. Leader Technology (U.S.)
6.1.1. Company Overview
6.1.2. Business Portfolio
6.1.3. Financial Overview
6.1.4. SWOT Analysis
6.1.5. Strategic Analysis
6.1.6. Recent Developments
6.2. AGCO Corporation (U.S.)
6.3. Deere & Company (U.S.)
6.4. Lindsay Corporation (U.S.)
6.5. Teejet Technologies (US)
6.6. The Climate Corporation (U.S.)
6.7. Trimble, Inc (U.S.)
6.8. Valmont Industries, Inc (U.S.)
7. Key Findings
8. Analyst Recommendations
8.1. Strategic Recommendations
8.2. Future Outlook