France Bike Sharing Market Industry Overview, Size, Share, Growth Trends, Research Insights and Forecast (2025–2032)
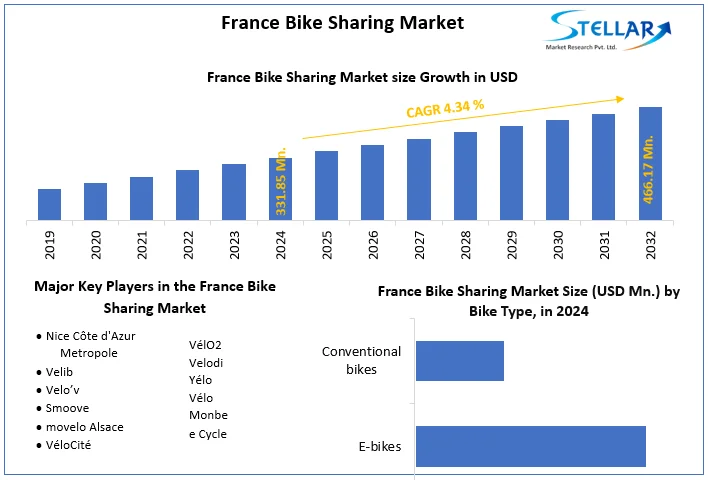
France Bike Sharing Market size was valued at US$ 331.85 Million in 2024 and the total France Bike Sharing Market revenue is expected to grow at 4.34% through 2025 to 2032 reaching nearly US$ 466.17 Million.
France Bike Sharing Market Overview:
A bike share system makes it possible to borrow bicycles from anyplace in a city. The model has attracted customers from all around the world because it is practical, has no theft issues, has no parking issues, and requires no maintenance. In the 1970s, the first French bike sharing scheme debuted in La Rochelle, when 350 free "yellow" bicycles were made accessible on the city's streets. Bike sharing did not take off in France and the rest of the world until 2005 and 2007, when the Vélo'v in Lyon and the Vélib in Paris were launched, respectively. In France, there are now over fifty cities having a bike-sharing system "with station" or in a hybrid form (possibility to lock the bike outside traditional stations). The number of systems in the globe has increased from 13 in 2004 to 1608 in 2020.
To get more Insights: Request Free Sample Report
France Bike Sharing Market Dynamics:
Behaviours were altered at the conclusion of the lockdown. Users who were wary of public transit switched to personal, as well as shared, forms of transportation. "The use of shared bicycles has climbed 2.5 times in some places in recent weeks, while metro ridership has plummeted by 40%," according to China, which experienced deconfinement a few weeks before France. Bicycles are one of the great winners in Paris for the year 2020. The deconfinement has accelerated consumption, which was already boosted by the December 2019 transit strikes. More than 15,000 new annual memberships were added, and the service reached a peak utilisation of 209,700 trips in one day at the beginning of September! In September, the 400,000 subscriber mark was also reached.
When compared to usual, the use of VCUBs during deconfinement increased by 30% in Bordeaux. According to French Transport Authority Survey, the increased use of VLS goes hand in hand with the explosion in the number of bike trips, whether personal or not (GPS bike guidance application). According to Vélo & Territoires, bike traffic on French cycling infrastructure increased by 29% in the post-confinement period (from May 11 to August 30) compared to 2019.
E bike Scenario in France:
Operators claim that the addition of e-bikes to bike sharing has resulted in a 2.5 to 3-fold increase in utilisation in some of the cities that have them. Users do not appear to choose e-bikes purely out of curiosity. Electric bicycles provide a number of advantages over traditional bicycles. Users' behaviour changes as a result of these benefits, and their impression of safety improves: people are less scared to force themselves on the road because the speed is comparable to that of vehicles in metropolitan areas. Mechanical bicycles are still popular in places with less defined topography, such as Bordeaux or Calais.
In Paris, electric bikes account for 40% of all bicycles, but they account for more than 57 percent of all trips (a mechanical bike is loaned on average 8 times, compared to 10 to 15 times for an electric bike!) However, when the percentage of trips taken by electric bikes increases, more maintenance costs are incurred, and not all batteries have enough time to recharge when the bike is used up to 20 times per day.
The newly launched E-Velo Bleu service in Nice appears to be off to a fantastic start. It has a rising number of subscribers, many of whom are former users of mechanical bicycles, and it is independent of the mechanical bicycle system. This is also true in Lyon, which has already posted positive results.
Increasing Hybridization of the systems across France:
The systems also tend to hybridise: while the emergence of "dockless" types of shared cars (without stations) characterised the year 2019, traditional Bike sharing market can take on similar forms with overflow (possibility of leaving the bike near the station, even if it is full). There are also easy-to-install portable station solutions for events that frequently require shared bikes. In metropolitan Lyon, for example, this is currently a major focus of effort.
For example, according to the Fluctuo 2020 French barometer of shared mobility, the average price of a 15 to 20 minute ride using a dock based system is €0.7, compared to €3.5 for a free floating system. Many cities have established electric bike-sharing programmes in response to the dramatic surge in personal electric bike sales. Some examples include Toronto, Canada, Tartu, Estonia, and Nice, France. The percentage of bikeshare systems using e-bikes climbed from 28% in 2019 to 44% in 2020, according to the NABSA's 2020 Shared Micromobility State of Industry Report. There are various advantages to using electric help.
France Bike Sharing Market Scope:
|
France Bike Sharing Market |
|
|
Market Size in 2024 |
USD 331.85 Mn. |
|
Market Size in 2032 |
USD 466.17 Mn. |
|
CAGR (2025-2032) |
4.34% |
|
Historic Data |
2019-2024 |
|
Base Year |
2024 |
|
Forecast Period |
2025-2032 |
|
Segment Scope |
by Bike Type
|
|
by Model
|
|
|
|
by Sharing System • Dockless • Docked • Hybrid |
France Bike Sharing Market Players
- Nice Côte d'Azur Metropole
- Velib
- Velo’v
- Smoove
- movelo Alsace
- VéloCité
- VélO2
- Velodi
- Yélo Vélo
- Monbee Cycle
Frequently Asked Questions
Paris, Lyon, Toulouse and Bordeaux region have the highest growth rate in the France Bike Sharing Market
Nice Côte d'Azur Metropole, Velib, Velo’v, Smoove, movelo Alsace, VéloCité, VélO2, Velodi, Yélo Vélo, Monbee Cycle are the key players in the France Bike Sharing Market.
Paris, Lyon, Toulouse and Bordeaux are the top regions in the France bike sharing market in terms of system installations.
1. France Bike Sharing Market: Research Methodology
1.1. Research Data
1.1.1. Secondary Data
1.1.2. Primary Data
1.2. Market Size Estimation
1.2.1. Bottom-Up Approach
1.2.2. Top-Up Approach
1.3. Market Breakdown and Data Triangulation
1.4. Research Assumption
2. France Bike Sharing Market Introduction
2.1. Study Assumption and Market Definition
2.2. Scope of the Study
2.3. Executive Summary
3. France Bike Sharing Market: Competitive Landscape
3.1. SMR Competition Matrix
3.2. Key Players Benchmarking
3.2.1. Company Name
3.2.2. Product Segment
3.2.3. End-user Segment
3.2.4. Revenue (2024)
3.2.5. Company Locations
3.3. Market Structure
3.3.1. Market Leaders
3.3.2. Market Followers
3.3.3. Emerging Players
3.4. Mergers and Acquisitions Details
4. France Bike Sharing Market: Dynamics
4.1. France Bike Sharing Market Trends
4.2. France Bike Sharing Market Dynamics
4.2.1. Drivers
4.2.2. Restraints
4.2.3. Opportunities
4.2.4. Challenges
4.3. PORTER’s Five Forces Analysis
4.4. PESTLE Analysis
4.5. Technological Roadmap
4.6. Regulatory Landscape
5. France Bike Sharing Market: Market Size and Forecast by Segmentation (by Value in USD Million) (2024-2032)
5.1. France Bike Sharing Market Size and Forecast, by Bike Type (2024-2032)
5.1.1. E-bikes
5.1.2. Conventional bikes
5.2. France Bike Sharing Market Size and Forecast, by Model (2024-2032)
5.2.1. Free-floating
5.2.2. P2P
5.2.3. Station Based
5.3. France Bike Sharing Market Size and Forecast, by Sharing System (2024-2032)
5.3.1. Dockless
5.3.2. Docked
5.3.3. Hybrid
6. Company Profile: Key Players
6.1. Nice Côte d'Azur Metropole
6.1.1. Company Overview
6.1.2. Business Portfolio
6.1.3. Financial Overview
6.1.4. SWOT Analysis
6.1.5. Strategic Analysis
6.1.6. Recent Developments
6.2. Velib
6.3. Velo’v
6.4. Smoove
6.5. movelo Alsace
6.6. VéloCité
6.7. VélO2
6.8. Velodi
6.9. Yélo Vélo
6.10. Monbee Cycle
7. Key Findings
8. Industry Recommendations