North American Cable Connector Market: Industry Analysis and Forecast (2024-2030) by Product, Type, Vertical and, Region
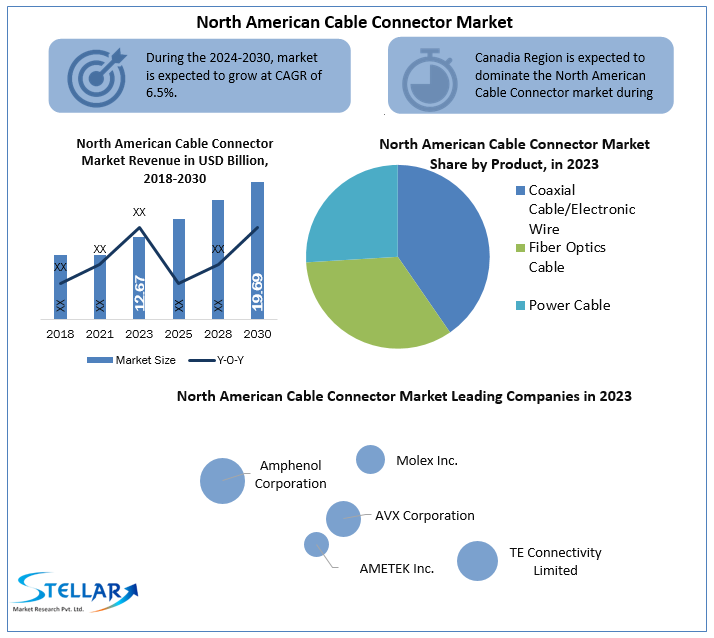
North American Cable Connector Market size was valued at US$ 12.67 Billion in 2023 and the total North American Cable Connector revenue is expected to grow at 6.5% through 2024 to 2030, reaching nearly US$ 19.69 Billion.
Format : PDF | Report ID : SMR_110
North American Cable Connector Market Overview:
According to research analyst Peter Jewett, North American consumption is expected to be driven by the increasing trend of larger data output per device, increasing complexity, and an increasing number of LAN nodes. Cable connectors are crucial components when it comes to different LAN setups. These connectors include plug and socket connectors, jacks, and individual plugs. The biggest players in the North American market include Amphenol Corporation, Molex Inc. from the US. Key players accomodating to higher data transmission rate, demands Of local consumers are one of the major contributors to the cable connector market from the USA, Canada, and Mexico. The fastest household broadband connections in urban regions of the United States reach as high as 10Gbps. These are provided by giants like Xfinity and Verizon. These companies create demand for cable connectors required for the installation of broadband connections in a residential area. For example, there were 120 million households in the USA in 2020 equipped with broadband connections (over 6 million more than the preceding year). These numbers are expected to reach over 200 million by 2030. The increasing consumption of broadband internet in the region is expected to drive the growth of the cable connectors market in North America.
To get more Insights: Request Free Sample Report
North American Cable Connector Market Dynamics:
A major driver in the North American cable connector market is higher R & D investments fiber optics cable industry. For example, AT&T had coverage of over 11.7% of the population in September 2020. Lumentum Holdings, a telecom equipment company situated in San Jose, California registered over US$ 139 million in the September of 2021 as compared to US$ 91 million a year prior. These steep increments in telecom company revenues which are the primary buyers of cable connectors are expected to drive the growth of the market in the forecast period (2024-2030).
Major restraints in the cable connector market include wear and tear, extreme temperatures, improper design, and installations, etc. e.g. RCA connectors used in television and video game consoles are known to fail in extreme temperatures and humid conditions. The intense competition among many key players is also expected to hamper the growth of the market in the same forecast period.
The key opportunity is the fact that control cables are constantly in demand in infrastructure and transportation industries. But their higher installation costs are expected to stall the regional market growth in North America.
North American Cable Connector Market Segment Analysis:
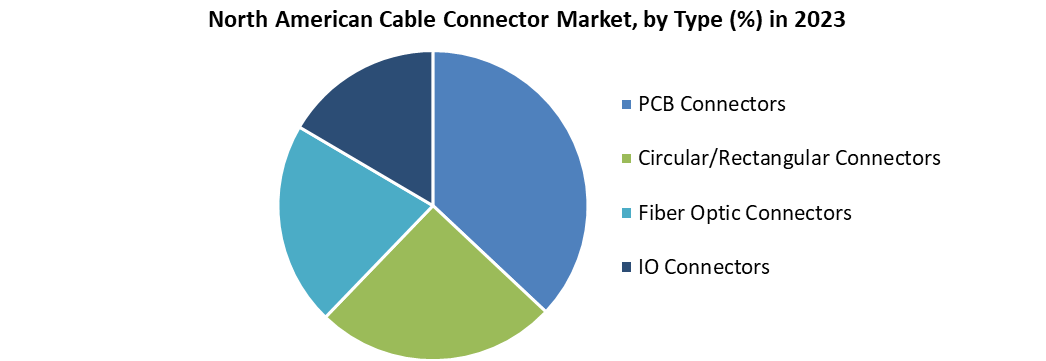
By Type, the Fiber optic segment held the largest share in 2023 with over 28% total shares. This segment is expected to witness a CAGR of 8.7% in the forecast period (2024-2030) in the North American region. The Fiber optics cable market was estimated to be around US$ 640 million in the same year. OFS, the leading fiber optics manufacturer in the United States was responsible for more than US$ 260 million worth of revenue in the same year, followed by Mouser Electronics with US$ 250 million worth of revenue. The rigorous competition among these two key players is expected to drive the growth of the fiber optic segment in the United States.
By Vertical, Industrial, and Manufacturing segment was the dominating segment in 2023 in the North American region. The industrial output of the United States alone was US$ 2.3 billion in the same year. With the growing demand in the manufacturing industry, different types of cables for automation, power transmission are manufactured. This in turn creates the need for cable connectors. E.g. Ethernet cable connectors, Sensor cable connectors, PCB cable connectors, etc.
IT and Telecom segments are expected to follow the industrial and manufacturing segment in terms of growth in the North American region. This segment is also expected to witness a CAGR of 10.7% in the aforementioned forecast period. The boom in the IT & Telecom segment is expected to drive the growth of the data cable connector segment.
North American Cable Connector Market Regional Insights:
The Canadian market held over 35% of the total cable connector market share in 2023. The Canadian market is expected to witness a high CAGR of 8.6% in the aforementioned forecast period. The Mexican market is expected to witness a low CAGR of 3.1% in the same forecast period due to a lack of major key players in the country. The two major key players in the cable connector market in Mexico include CONDUMEX and Soleil Wire. The former was responsible for over US$ 1.6 billion in revenue in 2020. The rampant political assassinations along with a history of organized crime drive the investors away from the Mexican market. This trend is expected to hamper the overall market growth in the North American region in the forecast period (2024-2030).
The purpose of this research is to provide stakeholders in the industry with a thorough insight into the North American Cable Connector market. The study includes an analysis of difficult data in simple language, as well as the industry's historical and current state, as well as anticipated market size and trends. The analysis examines all areas of the industry, with a focus on significant companies such as market leaders, followers, and newcomers.
The research includes a PORTER, PESTEL analysis as well as the possible influence of microeconomic market determinants. External and internal elements that are expected to have a favorable or negative impact on the firm have been examined, providing decision-makers with a clear future vision of the industry.
The research also aids in comprehending the North American Cable Connector market dynamics and structure by studying market segments and forecasting market size. The research is an investor's guide since it depicts the competitive analysis of major competitors in the North American Cable Connector market by product, price, financial situation, product portfolio, growth plans, and geographical presence.
North American Cable Connector Market Scope:
|
North American Cable Connector Market |
|
|
Market Size in 2023 |
USD 12.67 Bn. |
|
Market Size in 2030 |
USD 19.69 Bn. |
|
CAGR (2024-2030) |
6.5 % |
|
Historic Data |
2018-2022 |
|
Base Year |
2023 |
|
Forecast Period |
2024-2030 |
|
Segment Scope |
By Product
|
|
By Type
|
|
|
By Vertical
|
|
|
Country Scope |
United States Canada Mexico |
North American Cable Connector Market Players
• Amphenol Corporation
• Molex Inc. (Koch Industries)
• AVX Corporation
• AMETEK Inc.
• TE Connectivity Limited
• ITT Interconnect Solutions
• Daburn Electronics & Cable and Polytron Devices
• LUTZE, Inc.
• EDAC, Inc.
• CONDUMEX S.A. De C.V.
• Soleil Wire S.A De C.V
Frequently Asked Questions
The US has the highest growth rate in North American Cable Connector Market.
A major driver in the North American cable connector market is higher R & D investments fiber optics cable industry.
The US has the largest share in North American Cable Connector Market.
Chapter 1 Scope of the Report
Chapter 2 Research Methodology
2.1. Research Process
2.2. North America Cable Connector Market: Target Audience
2.3. North America Cable Connector Market: Primary Research (As per Client Requirement)
2.4. North America Cable Connector Market: Secondary Research
Chapter 3 Executive Summary
Chapter 4 Competitive Landscape
4.1. Market Share Analysis, By Value, 2023-2030
4.1.1. Market Share Analysis, By Region, By Value, 2023-2030 (In %)
4.1.1.1. North America Market Share Analysis, By Value, 2023-2030 (In %)
4.1.2. Market Share Analysis, By Product, By Value, 2023-2030 (In %)
4.1.2.1. North America Market Share Analysis, By Product, By Value, 2023-2030 (In %)
4.1.2.1.1. USA Market Share Analysis, By Product, By Value, 2023-2030 (In %)
4.1.2.1.2. Canada Market Share Analysis, By Product, By Value, 2023-2030 (In %)
4.1.2.1.3. Mexico Market Share Analysis, By Product, By Value, 2023-2030 (In %)
4.1.3. Market Share Analysis, By Type, By Value, 2023-2030 (In %)
4.1.3.1. North America Market Share Analysis, By Type, By Value, 2023-2030 (In %)
4.1.3.1.1. USA Market Share Analysis, By Type, By Value, 2023-2030 (In %)
4.1.3.1.2. Canada Market Share Analysis, By Type, By Value, 2023-2030 (In %)
4.1.3.1.3. Mexico Market Share Analysis, By Type, By Value, 2023-2030 (In %)
4.1.4. Market Share Analysis, By Vertical, By Value, 2023-2030 (In %)
4.1.4.1. North America Market Share Analysis, By Vertical, By Value, 2023-2030 (In %)
4.1.4.1.1. USA Market Share Analysis, By Vertical, By Value, 2023-2030 (In %)
4.1.4.1.2. Canada Market Share Analysis, By Vertical, By Value, 2023-2030 (In %)
4.1.4.1.3. Mexico Market Share Analysis, By Vertical, By Value, 2023-2030 (In %)
4.2. Stellar Competition matrix
4.2.1. North America Stellar Competition Matrix
4.3. Key Players Benchmarking
4.3.1. Key Players Benchmarking by Product, Pricing, Market Share, Investments, Expansion Plans, Physical Presence, and Presence in the Market.
4.4. Mergers and Acquisitions in Industry
4.4.1. M&A by Region, Value and Strategic Intent
4.5. Market Dynamics
4.5.1. Market Drivers
4.5.2. Market Restraints
4.5.3. Market Opportunities
4.5.4. Market Challenges
4.5.5. PESTLE Analysis
4.5.6. PORTERS Five Force Analysis
4.5.7. Value Chain Analysis
Chapter 5 North America Cable Connector Market Segmentation: By Product
5.1. North America Cable Connector Market, By Product, Overview/Analysis, 2023-2030
5.2. North America Cable Connector Market, By Product, By Value, Market Share (%), 2023-2030 (USD Billion)
5.3. North America Cable Connector Market, By Product, By Value, -
5.3.1. Coaxial Cable/Electronic Wire
5.3.2. Fiber Optics Cable
5.3.3. Power Cable
5.3.4. Signal and Control Cable
5.3.5. Telecom and Data Cable
Chapter 6 North America Cable Connector Market Segmentation: By Type
6.1. North America Cable Connector Market, By Type, Overview/Analysis, 2023-2030
6.2. North America Cable Connector Market Size, By Type, By Value, Market Share (%), 2023-2030 (USD Billion)
6.3. North America Cable Connector Market, By Type, By Value, -
6.3.1. PCB Connectors
6.3.2. Circular/Rectangular Connectors
6.3.3. Fiber Optic Connectors
6.3.4. IO Connectors
Chapter 7 North America Cable Connector Market Segmentation: By Vertical
7.1. North America Cable Connector Market, By Vertical, Overview/Analysis, 2023-2030
7.2. North America Cable Connector Market Size, By Vertical, By Value, Market Share (%), 2023-2030 (USD Billion)
7.3. North America Cable Connector Market, By Vertical, By Value, -
7.3.1. IT & Telecommunication
7.3.2. Automotive
7.3.3. Aerospace & defense
7.3.4. Consumer Electronics
7.3.5. Industrial and Manufacturing
7.3.6. Energy & Power
7.3.7. Oil & Gas
Chapter 8 North America Cable Connector Market Segmentation: By Region
8.1. North America Cable Connector Market, By Region – North America
8.1.1. North America Cable Connector Market Size, By Product, By Value, 2023-2030 (USD Billion)
8.1.2. North America Cable Connector Market Size, By Type, By Value, 2023-2030 (USD Billion)
8.1.3. North America Cable Connector Market Size, By Vertical, By Value, 2023-2030 (USD Billion)
8.1.4. By Country – U.S.
8.1.4.1. U.S. Cable Connector Market Size, By Product, By Value, 2023-2030 (USD Billion)
8.1.4.2. U.S. Cable Connector Market Size, By Type, By Value, 2023-2030 (USD Billion)
8.1.4.3. U.S. Cable Connector Market Size, By Vertical, By Value, 2023-2030 (USD Billion)
8.1.5. Canada Cable Connector Market Size, By Value, 2023-2030 (USD Billion)
8.1.6. Mexico Cable Connector Market Size, By Value, 2023-2030 (USD Billion)
Chapter 9 Company Profiles
9.1. Key Players
9.1.1. Amphenol Corporation
9.1.1.1. Company Overview
9.1.1.2. Product Portfolio
9.1.1.3. Financial Overview
9.1.1.4. Business Strategy
9.1.1.5. Key Developments
9.1.2. Molex Inc. (Koch Industries)
9.1.3. AVX Corporation
9.1.4. AMETEK Inc.
9.1.5. TE Connectivity Limited
9.1.6. ITT Interconnect Solutions
9.1.7. Daburn Electronics & Cable and Polytron Devices
9.1.8. LUTZE, Inc.
9.1.9. EDAC, Inc.
9.1.10. CONDUMEX S.A. De C.V.
9.1.11. Soleil Wire S.A De C.V
9.2. Key Findings
9.3. Recommendations


