Smart Irrigation Market: Industry Overview (2024-2030) by Component, System Type, Application and, Region
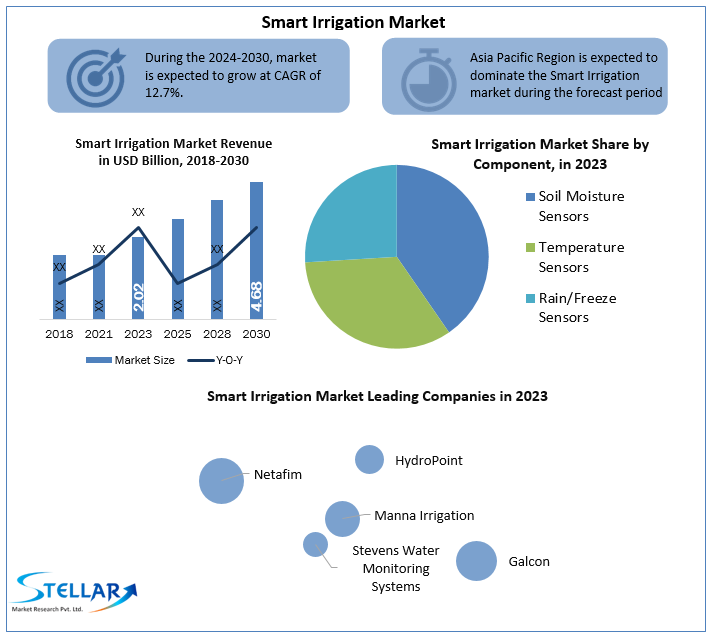
Smart Irrigation Market size was valued at US$ 2.02 Billion in 2023 and the total Smart Irrigation revenue is expected to grow at 12.7% through 2024 to 2030, reaching nearly US$ 4.68 Billion.
Format : PDF | Report ID : SMR_387
Smart Irrigation Market Overview:
Sprinkler schedules and run periods are automatically tailored by smart irrigation systems to match individual landscape demands. These smart controls considerably increase the efficiency of outdoor water usage. Smart irrigation controllers track weather, soil quality, precipitation, and plant water usage to proactively modify the sprinkler schedule to the real conditions of the site, unlike standard irrigation controllers that function on a fixed programmed schedule and timings. Smart irrigation controllers, for example, change spraying run times or schedules when external temperatures rise or rainfall falls, taking into account site-specific characteristics like soil type, sprinkler rate of application, and so on.
The worldwide COVID-19 outbreak has had an impact on the smart irrigation market. COVID-19 has disrupted a number of areas of the economy, including agriculture. The increased awareness among farmers to use advanced technologies for commercial farms, which can ultimately lead to the automated processes of several site activities such as the use of sensing devices including rain sensors, weather sensors, moisture sensors, thermistors, is a positive aspect of this pandemic.
The market's growth drivers, as well as the market's segments (Component, System Type, Application and, Region), are analyzed in this research. Market participants, regions, and special requirements have all provided data. This market study provides an in-depth look at all of the important advancements that are currently taking place across all industry sectors. Statistics, infographics, and presentations are used to provide key data analysis. The analysis looks at the market's Drivers, Restraints, Opportunities, and Challenges for the Smart Irrigation market. The study aids in the evaluation of market growth drivers and the determination of how to employ these drivers as a tool. The research also aids in the correction and resolution of difficulties with the global smart irrigation market.
To get more Insights: Request Free Sample Report
Smart Irrigation Market Dynamics:
A key reason for the growth of smart irrigation market is the rising relevance of effective watering techniques and irrigation systems for non-agricultural sectors such as housing, lawn and landscaping, and golf resorts. Smart cities are a growing trend in many regions of the world. The effective handling of water in residential and business spaces is emphasized in smart cities. Due to the loss of green cover as a result of urbanization to make room for concrete infrastructure, it is necessary to preserve the green equilibrium, where the intelligent irrigation idea is being used. In smart cities, the usage of smart irrigation controls is predicted to skyrocket over the forecast period.
An intelligent irrigation system is still too costly for small farmers in wealthy nations and the majority of landowners in growing economies. The advantages of IT technology are now confined to sophisticated nations, with a concentration on the cultivation of well-known and extensively produced commodities like wheat and rice. For the ongoing and successful use of technology, smart irrigation necessitates large initial expenditures, efficient agricultural instruments, longer waiting times, and competent and informed farmers or producers, among other things.
The Smart Irrigation Market has great future growt opportunity as organic farmers and homeowners may now remotely access their irrigation canals thanks to advancements in telecommunications. Wireless transmission technologies are replacing conventional hardwired ones. Advanced wireless sensors provide flexibility, simplicity, and other advantages. Irrigation with radiofrequency technology connects to wireless signal transmission networks. Technological advancements improve compatibility between the command center and the machinery, which improves the total irrigation process performance.
Smart Irrigation Market Segment Analysis:
By Component, the sensor segment dominated the smart irrigation market in 2023 with 45.6% of total shares. It is expected to witness a CAGR of 8.2% in the aforementioned forecast period.
This rise might be due to the growing use of sensor-based watering systems in agriculture to save water and boost crop productivity. Sensor-based systems have the potential of analyzing accurate information from large sensors deployed on the farm, such as temperature, moisture levels, rainfall, and humidity. Sensor-based systems are also preferable to weather-based solutions since they do not depend on weather predictions or information from meteorological stations.
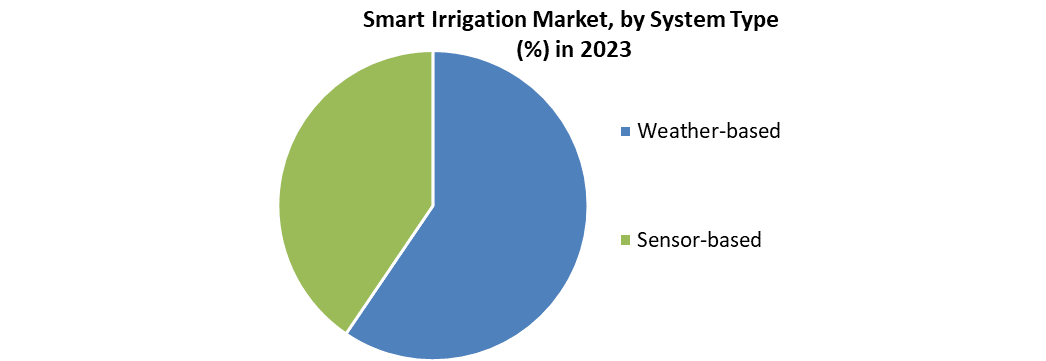
Sensor-based solutions assist in the data gathering from remote sensors and the transport of that information in the cloud. The amount of water content in the soil is fed into sensor-based intelligent irrigation controls. As a result, as soon as the measurement falls underneath the critical threshold, the smart irrigation system begins watering that specific zone or area. They outperform climate-based methods because they can adapt to precise zone watering demands based on real moisture availability.
Smart Irrigation Market Regional Insights:
Due to factors such as the rising adoption of IoT-based crop irrigation in nations e.g. China and India, growing usage of smartphones and tablets to remotely monitor farm data, and growth capital in the agriculture tech industry in the Asia Pacific region, the Asia-Pacific smart irrigation market is anticipated to grow at the highest CAGR of 9.3% during the forecast period.
Moreover, due to strict water supply regulations, there is a considerable need for intelligent watering in this region. China and South Korea are the area's significant contributors. The Asia Pacific is known for its agriculture sector.
As a result, the industry's demand outlook is bright in the foreseeable term. In all of these locations, rising demand is mostly due to increased Research and Development and energy conservation. Intelligent irrigation devices are being used at a quicker rate in housing neighborhoods as well. The rising adoption of remote sensing techniques and the incorporation of IoT systems with mobile phones in countries like India and Australia are primary drivers factors that drive the growth of the smart irrigation market in the Asia Pacific.
The purpose of this research is to provide stakeholders in the industry with a thorough insight into the Smart Irrigation Market. The study includes an analysis of difficult data in simple language, as well as the industry's historical and current state, as well as anticipated market size and trends. The market report examines all segments of the industry, with a focus on significant players such as market leaders, followers, and new entrants. The report includes a PORTER, PESTEL analysis as well as the possible influence of microeconomic market determinants. External and internal elements that are expected to have a favorable or negative impact on the firm have been examined, providing decision-makers with a clear future vision of the industry. The research also aids in comprehending the Smart Irrigation Market dynamics and structure by studying market segments and forecasting market size. The research is an investor's guide since it depicts the competitive analysis of major competitors in the Smart Irrigation Market by product, price, financial situation, product portfolio, growth plans, and geographical presence.
Breakthroughs in the Smart Irrigation industry are discussed, as well as organic and inorganic growth plans. Various companies are focusing on organic growth strategies such as new product releases, product approvals, and other items such as patents and events. Inorganic growth strategies used in the industry included acquisitions, partnerships, and collaborations.
Smart Irrigation Market Scope:
|
Smart Irrigation Market |
|
|
Market Size in 2023 |
USD 2.02 Bn. |
|
Market Size in 2030 |
USD 4.68 Bn. |
|
CAGR (2024-2030) |
12.7% |
|
Historic Data |
2018-2022 |
|
Base Year |
2023 |
|
Forecast Period |
2024-2030 |
|
Segment Scope |
By Component
|
|
By System Type
|
|
|
By Application
|
|
|
Regional Scope |
North America- United States, Canada, and Mexico Europe – UK, France, Germany, Italy, Spain, Sweden, Austria, and Rest of Europe Asia Pacific – China, India, Japan, South Korea, Australia, ASEAN, Rest of APAC Middle East and Africa - South Africa, GCC, Egypt, Nigeria, Rest of the Middle East and Africa South America – Brazil, Argentina, Rest of South America |
Smart Irrigation Market Players:
- Netafim (Israel)
- HydroPoint (US)
- Manna Irrigation (Israel)
- Stevens Water Monitoring Systems (US)
- Galcon (Israel)
- Rachio (US)
- Weathermatic (US)
- Jain Irrigation Systems (India)
- Banyan Water (US)
- Delta-T Devices (UK)
- Calsense (US)
- Skydrop (US)
- AquaSpy (US)
- Soil Scout (Finland)
- Caipos (Austria)
Frequently Asked Questions
An intelligent irrigation system is still too costly for small farmers in wealthy nations and the majority of landowners in growing economies.
The key players are Calsense, Aquaspy, etc.
the sensor segment is expected to witness a CAGR of 8.2% in the aforementioned forecast period.
Chapter 1 Scope of the Report
Chapter 2 Research Methodology
2.1. Research Process
2.2. Global Smart Irrigation Market: Target Audience
2.3. Global Smart Irrigation Market: Primary Research (As per Client Requirement)
2.4. Global Smart Irrigation Market: Secondary Research
Chapter 3 Executive Summary
Chapter 4 Competitive Landscape
4.1. Market Share Analysis, By Value, 2023-2030
4.1.1. Market Share Analysis, By Region, By Value, 2023-2030 (In %)
4.1.1.1. North America Market Share Analysis, By Value, 2023-2030 (In %)
4.1.1.2. Europe Market Share Analysis, By Value, 2023-2030 (In %)
4.1.1.3. Asia Pacific Market Share Analysis, By Value, 2023-2030 (In %)
4.1.1.4. South America Market Share Analysis, By Value, 2023-2030 (In %)
4.1.1.5. Middle East and Africa Market Share Analysis, By Value, 2023-2030 (In %)
4.1.2. Market Share Analysis, By Component, By Value, 2023-2030 (In %)
4.1.2.1. North America Market Share Analysis, By Component, By Value, 2023-2030 (In %)
4.1.2.1.1. USA Market Share Analysis, By Component, By Value, 2023-2030 (In %)
4.1.2.1.2. Canada Market Share Analysis, By Component, By Value, 2023-2030 (In %)
4.1.2.1.3. Mexico Market Share Analysis, By Component, By Value, 2023-2030 (In %)
4.1.2.2. Europe Market Share Analysis, By Component, By Value, 2023-2030 (In %)
4.1.2.2.1. UK Market Share Analysis, By Component, By Value, 2023-2030 (In %)
4.1.2.2.2. France Market Share Analysis, By Component, By Value, 2023-2030 (In %)
4.1.2.2.3. Germany Market Share Analysis, By Component, By Value, 2023-2030 (In %)
4.1.2.2.4. Italy Market Share Analysis, By Component, By Value, 2023-2030 (In %)
4.1.2.2.5. Spain Market Share Analysis, By Component, By Value, 2023-2030 (In %)
4.1.2.2.6. Sweden Market Share Analysis, By Component, By Value, 2023-2030 (In %)
4.1.2.2.7. Austria Market Share Analysis, By Component, By Value, 2023-2030 (In %)
4.1.2.2.8. Rest of Europe Market Share Analysis, By Component, By Value, 2023-2030 (In %)
4.1.2.3. Asia Pacific Market Share Analysis, By Component, By Value, 2023-2030 (In %)
4.1.2.3.1. China Market Share Analysis, By Component, By Value, 2023-2030 (In %)
4.1.2.3.2. India Market Share Analysis, By Component, By Value, 2023-2030 (In %)
4.1.2.3.3. Japan Market Share Analysis, By Component, By Value, 2023-2030 (In %)
4.1.2.3.4. South Korea Market Share Analysis, By Component, By Value, 2023-2030 (In %)
4.1.2.3.5. Australia Market Share Analysis, By Component, By Value, 2023-2030 (In %)
4.1.2.3.6. ASEAN Market Share Analysis, By Component, By Value, 2023-2030 (In %)
4.1.2.3.7. Rest of APAC Market Share Analysis, By Component, By Value, 2023-2030 (In %)
4.1.2.4. South America Market Share Analysis, By Component, By Value, 2023-2030 (In %)
4.1.2.4.1. Brazil Market Share Analysis, By Component, By Value, 2023-2030 (In %)
4.1.2.4.2. Argentina Market Share Analysis, By Component, By Value, 2023-2030 (In %)
4.1.2.4.3. Rest of South America Market Share Analysis, By Component, By Value, 2023-2030 (In %)
4.1.2.5. Middle East and Africa Market Share Analysis, By Component, By Value, 2023-2030 (In %)
4.1.2.5.1. South Africa Market Share Analysis, By Component, By Value, 2023-2030 (In %)
4.1.2.5.2. GCC Market Share Analysis, By Component, By Value, 2023-2030 (In %)
4.1.2.5.3. Egypt Market Share Analysis, By Component, By Value, 2023-2030 (In %)
4.1.2.5.4. Nigeria Market Share Analysis, By Component, By Value, 2023-2030 (In %)
4.1.2.5.5. Rest of Middle East and Africa Market Share Analysis, By Component, By Value, 2023-2030 (In %)
4.1.3. Market Share Analysis, By System Type, By Value, 2023-2030 (In %)
4.1.3.1. North America Market Share Analysis, By System Type, By Value, 2023-2030 (In %)
4.1.3.1.1. USA Market Share Analysis, By System Type, By Value, 2023-2030 (In %)
4.1.3.1.2. Canada Market Share Analysis, By System Type, By Value, 2023-2030 (In %)
4.1.3.1.3. Mexico Market Share Analysis, By System Type, By Value, 2023-2030 (In %)
4.1.3.2. Europe Market Share Analysis, By System Type, By Value, 2023-2030 (In %)
4.1.3.2.1. UK Market Share Analysis, By System Type, By Value, 2023-2030 (In %)
4.1.3.2.2. France Market Share Analysis, By System Type, By Value, 2023-2030 (In %)
4.1.3.2.3. Germany Market Share Analysis, By System Type, By Value, 2023-2030 (In %)
4.1.3.2.4. Italy Market Share Analysis, By System Type, By Value, 2023-2030 (In %)
4.1.3.2.5. Spain Market Share Analysis, By System Type, By Value, 2023-2030 (In %)
4.1.3.2.6. Sweden Market Share Analysis, By System Type, By Value, 2023-2030 (In %)
4.1.3.2.7. Austria Market Share Analysis, By System Type, By Value, 2023-2030 (In %)
4.1.3.2.8. Rest of Europe Market Share Analysis, By System Type, By Value, 2023-2030 (In %)
4.1.3.3. Asia Pacific Market Share Analysis, By System Type, By Value, 2023-2030 (In %)
4.1.3.3.1. China Market Share Analysis, By System Type, By Value, 2023-2030 (In %)
4.1.3.3.2. India Market Share Analysis, By System Type, By Value, 2023-2030 (In %)
4.1.3.3.3. Japan Market Share Analysis, By System Type, By Value, 2023-2030 (In %)
4.1.3.3.4. South Korea Market Share Analysis, By System Type, By Value, 2023-2030 (In %)
4.1.3.3.5. Australia Market Share Analysis, By System Type, By Value, 2023-2030 (In %)
4.1.3.3.6. ASEAN Market Share Analysis, By System Type, By Value, 2023-2030 (In %)
4.1.3.3.7. Rest of APAC Market Share Analysis, By System Type, By Value, 2023-2030 (In %)
4.1.3.4. South America Market Share Analysis, By System Type, By Value, 2023-2030 (In %)
4.1.3.4.1. Brazil Market Share Analysis, By System Type, By Value, 2023-2030 (In %)
4.1.3.4.2. Argentina Market Share Analysis, By System Type, By Value, 2023-2030 (In %)
4.1.3.4.3. Rest of South America Market Share Analysis, By System Type, By Value, 2023-2030 (In %)
4.1.3.5. Middle East and Africa Market Share Analysis, By System Type, By Value, 2023-2030 (In %)
4.1.3.5.1. South Africa Market Share Analysis, By System Type, By Value, 2023-2030 (In %)
4.1.3.5.2. GCC Market Share Analysis, By System Type, By Value, 2023-2030 (In %)
4.1.3.5.3. Egypt Market Share Analysis, By System Type, By Value, 2023-2030 (In %)
4.1.3.5.4. Nigeria Market Share Analysis, By System Type, By Value, 2023-2030 (In %)
4.1.3.5.5. Rest of Middle East and Africa Market Share Analysis, By System Type, By Value, 2023-2030 (In %)
4.1.4. Market Share Analysis, By Application, By Value, 2023-2030 (In %)
4.1.4.1. North America Market Share Analysis, By Application, By Value, 2023-2030 (In %)
4.1.4.1.1. USA Market Share Analysis, By Application, By Value, 2023-2030 (In %)
4.1.4.1.2. Canada Market Share Analysis, By Application, By Value, 2023-2030 (In %)
4.1.4.1.3. Mexico Market Share Analysis, By Application, By Value, 2023-2030 (In %)
4.1.4.2. Europe Market Share Analysis, By Application, By Value, 2023-2030 (In %)
4.1.4.2.1. UK Market Share Analysis, By Application, By Value, 2023-2030 (In %)
4.1.4.2.2. France Market Share Analysis, By Application, By Value, 2023-2030 (In %)
4.1.4.2.3. Germany Market Share Analysis, By Application, By Value, 2023-2030 (In %)
4.1.4.2.4. Italy Market Share Analysis, By Application, By Value, 2023-2030 (In %)
4.1.4.2.5. Spain Market Share Analysis, By Application, By Value, 2023-2030 (In %)
4.1.4.2.6. Sweden Market Share Analysis, By Application, By Value, 2023-2030 (In %)
4.1.4.2.7. Austria Market Share Analysis, By Application, By Value, 2023-2030 (In %)
4.1.4.2.8. Rest of Europe Market Share Analysis, By Application, By Value, 2023-2030 (In %)
4.1.4.3. Asia Pacific Market Share Analysis, By Application, By Value, 2023-2030 (In %)
4.1.4.3.1. China Market Share Analysis, By Application, By Value, 2023-2030 (In %)
4.1.4.3.2. India Market Share Analysis, By Application, By Value, 2023-2030 (In %)
4.1.4.3.3. Japan Market Share Analysis, By Application, By Value, 2023-2030 (In %)
4.1.4.3.4. South Korea Market Share Analysis, By Application, By Value, 2023-2030 (In %)
4.1.4.3.5. Australia Market Share Analysis, By Application, By Value, 2023-2030 (In %)
4.1.4.3.6. ASEAN Market Share Analysis, By Application, By Value, 2023-2030 (In %)
4.1.4.3.7. Rest of APAC Market Share Analysis, By Application, By Value, 2023-2030 (In %)
4.1.4.4. South America Market Share Analysis, By Application, By Value, 2023-2030 (In %)
4.1.4.4.1. Brazil Market Share Analysis, By Application, By Value, 2023-2030 (In %)
4.1.4.4.2. Argentina Market Share Analysis, By Application, By Value, 2023-2030 (In %)
4.1.4.4.3. Rest of South America Market Share Analysis, By Application, By Value, 2023-2030 (In %)
4.1.4.5. Middle East and Africa Market Share Analysis, By Application, By Value, 2023-2030 (In %)
4.1.4.5.1. South Africa Market Share Analysis, By Application, By Value, 2023-2030 (In %)
4.1.4.5.2. GCC Market Share Analysis, By Application, By Value, 2023-2030 (In %)
4.1.4.5.3. Egypt Market Share Analysis, By Application, By Value, 2023-2030 (In %)
4.1.4.5.4. Nigeria Market Share Analysis, By Application, By Value, 2023-2030 (In %)
4.1.4.5.5. Rest of Middle East and Africa Market Share Analysis, By Application, By Value, 2023-2030 (In %)
4.2. Stellar Competition matrix
4.2.1. Global Stellar Competition Matrix
4.2.2. North America Stellar Competition Matrix
4.2.3. Europe Stellar Competition Matrix
4.2.4. Asia Pacific Stellar Competition Matrix
4.2.5. South America Stellar Competition Matrix
4.2.6. Middle East and Africa Stellar Competition Matrix
4.3. Key Players Benchmarking
4.3.1. Key Players Benchmarking By Component, Pricing, Market Share, Investments, Expansion Plans, Physical Presence and Presence in the Market.
4.4. Mergers and Acquisitions in Industry
4.4.1. M&A by Region, Value and Strategic Intent
4.5. Market Dynamics
4.5.1. Market Drivers
4.5.2. Market Restraints
4.5.3. Market Opportunities
4.5.4. Market Challenges
4.5.5. PESTLE Analysis
4.5.6. PORTERS Five Force Analysis
4.5.7. Value Chain Analysis
Chapter 5 Global Smart Irrigation Market Segmentation: By Component
5.1. Global Smart Irrigation Market, By Component, Overview/Analysis, 2023-2030
5.2. Global Smart Irrigation Market, By Component, By Value, Market Share (%), 2023-2030 (USD Billion)
5.3. Global Smart Irrigation Market, By Component, By Value, -
5.3.1. Controllers
5.3.2. (Evapotranspiration) ET-Based
5.3.3. Soil Sensor-Based
5.3.4. Sensors
5.3.5. Soil Moisture Sensors
5.3.6. Temperature Sensors
5.3.7. Rain/Freeze Sensors
5.3.8. Fertigation Sensors
5.3.9. Others
Chapter 6 Global Smart Irrigation Market Segmentation: By System Type
6.1. Global Smart Irrigation Market, By System Type, Overview/Analysis, 2023-2030
6.2. Global Smart Irrigation Market Size, By System Type, By Value, Market Share (%), 2023-2030 (USD Billion)
6.3. Global Smart Irrigation Market, By System Type, By Value, -
6.3.1. Weather-based
6.3.2. Sensor-based
Chapter 7 Global Smart Irrigation Market Segmentation: By Application
7.1. Global Smart Irrigation Market, By Application, Overview/Analysis, 2023-2030
7.2. Global Smart Irrigation Market Size, By Application, By Value, Market Share (%), 2023-2030 (USD Billion)
7.3. Global Smart Irrigation Market, By Application, By Value, -
7.3.1. Agricultural
7.3.2. Greenhouses
7.3.3. Open-fields
7.3.4. Non-Agricultural
7.3.5. Residential
7.3.6. Turf & Landscape
7.3.7. Golf Courses
7.3.8. Other
Chapter 8 Global Smart Irrigation Market Segmentation: By Region
8.1. Global Smart Irrigation Market, By Region – North America
8.1.1. North America Smart Irrigation Market Size, By Component, By Value, 2023-2030 (USD Billion)
8.1.2. North America Smart Irrigation Market Size, By System Type, By Value, 2023-2030 (USD Billion)
8.1.3. North America Smart Irrigation Market Size, By Application, By Value, 2023-2030 (USD Billion)
8.1.4. By Country – U.S.
8.1.4.1. U.S. Smart Irrigation Market Size, By Component, By Value, 2023-2030 (USD Billion)
8.1.4.2. U.S. Smart Irrigation Market Size, By System Type, By Value, 2023-2030 (USD Billion)
8.1.4.3. U.S. Smart Irrigation Market Size, By Application, By Value, 2023-2030 (USD Billion)
8.1.4.4. Canada Smart Irrigation Market Size, By Value, 2023-2030 (USD Billion)
8.1.4.5. Mexico Smart Irrigation Market Size, By Value, 2023-2030 (USD Billion)
8.2. Europe Smart Irrigation Market Size, By Value, 2023-2030 (USD Billion)
8.2.1. UK
8.2.2. France
8.2.3. Germany
8.2.4. Italy
8.2.5. Spain
8.2.6. Sweden
8.2.7. Austria
8.2.8. Rest of Europe
8.3. Asia Pacific Smart Irrigation Market Size, By Value, 2023-2030 (USD Billion)
8.3.1. China
8.3.2. India
8.3.3. Japan
8.3.4. South Korea
8.3.5. Australia
8.3.6. ASEAN
8.3.7. Rest of APAC
8.4. Middle East and Africa Smart Irrigation Market Size, By Value, 2023-2030 (USD Billion)
8.4.1. South Africa
8.4.2. GCC
8.4.3. Egypt
8.4.4. Nigeria
8.4.5. Rest of Middle East and Africa
8.5. South America Smart Irrigation Market Size, By Value, 2023-2030 (USD Billion)
8.5.1. Brazil
8.5.2. Argentina
8.5.3. Rest of South America
Chapter 9 Company Profiles
9.1. Key Players
9.1.1. Netafim (Israel)
9.1.1.1. Company Overview
9.1.1.2. Tube Portfolio
9.1.1.3. Financial Overview
9.1.1.4. Business Strategy
9.1.1.5. Key Developments
9.1.2. HydroPoint (US)
9.1.3. Manna Irrigation (Israel)
9.1.4. Stevens Water Monitoring Systems (US)
9.1.5. Galcon (Israel)
9.1.6. Rachio (US)
9.1.7. Weathermatic (US)
9.1.8. Jain Irrigation Systems (India)
9.1.9. Banyan Water (US)
9.1.10. Delta-T Devices (UK)
9.1.11. Calsense (US)
9.1.12. Skydrop (US)
9.1.13. AquaSpy (US)
9.1.14. Soil Scout (Finland)
9.1.15. Caipos (Austria)
9.2. Key Findings
9.3. Recommendations


