Hydrogen Generation Market: Global Industry Analysis, Size, Share, Growth, Trend, and Forecast 2024-2030
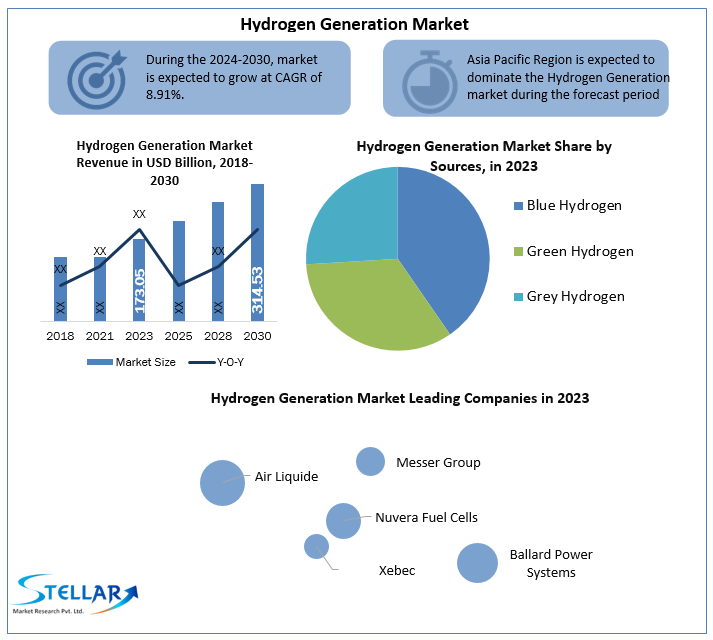
Hydrogen Generation Market size was valued at US$ 173.05 Bn. in 2023. Hydrogen Generation Market is estimated to grow at a CAGR of 8.91% over the forecast period
Format : PDF | Report ID : SMR_370
Hydrogen Generation Market Overview:
Hydrogen is produced by utilizing a variety of procedures and resources. For example, the thermochemical method requires the use of fossil fuels to release hydrogen, whereas other systems use electrolysis or solar energy to split water into hydrogen and oxygen. At the moment, new technologies based on bacteria and algae are being presented, which are likewise cost-effective, efficient, and environmentally benign. The demand in hydrogen generation market is now increasing in the refining of petroleum, the treatment of metals, the production of fertilizers, and the processing of food goods. In addition, it's gaining popularity as a fuel in electric cars (EVs) across the globe.
To get more Insights: Request Free Sample Report
Hydrogen Generation Market Dynamics:
Unique Advantages and Applications Hydrogen:
The introduction of numerous legislation aimed at the adoption of clean fuels, along with increased expenditures across the refining sector, is expected to boost the market environment. The introduction of regulation of various incentive programs with the goal of limiting the quantity of sulfur content in diesel fuel, gasoline, and motor oil hepls in the growth of hydrogen generation market demand during the forecast period.
Government Initiatives for Desulfurization and Greenhouse Gas Emissions:
The greenhouse gas emissions are continuously rising across the globe, owing mostly to the use of fossil fuels and industrialization. Greenhouse gas emissions, such as carbon dioxide, nitrous oxide, and methane, are responsible for the rising global temperature, which has risen by about 1° C during the last century. For instance, the United States, the European Union, Russia, and China are responsible for 65% of global emissions. The United States alone accounts for 25% of these. In addition, the amount of sulphur in gasoline has a direct and indirect effect on greenhouse gas emissions. Sulfur obstructs the efficient operation of some catalysts, resulting in increased methane emissions from oxidation catalysts and higher carbon dioxide emissions from more advanced technology. Sulfur also stifles the development of emission-control technology in a number of areas, including fuel-efficient gasoline engine designs, traditional diesel as a fuel-efficient alternative, and advanced or hybrid diesel.
Growing Demand for Green Hydrogen:
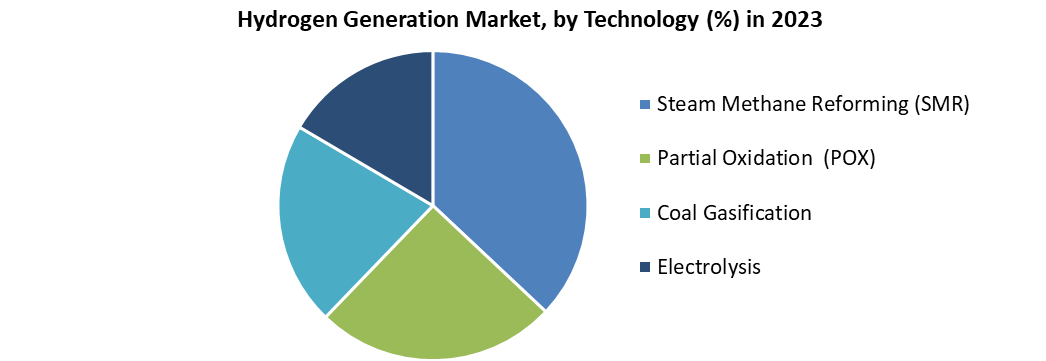
Hydrogen is currently produced using a variety of processes, including steam methane reforming, partial oil oxidation, coal gasification, and water electrolysis. The majority of hydrogen produced today is used in petroleum refineries and fertilizer production. 99% of it is derived from fossil fuel reformation, which is the most cost-effective way. However, because CO2 is released in the process, there are no climatic advantages. Green hydrogen is produced by the electrolysis of water using renewable energy sources such as onshore and offshore wind and solar power. Green hydrogen offers a wide range of uses, from industrial feedstock to fuel cells and energy storage. Green Hydrogen may avoid 830 million tonnes of CO2 emitted annually by burning fossil fuels. Green hydrogen is created by breaking down water molecules into hydrogen and oxygen using electrolysis from renewable energy sources such as solar and wind power. The notion of green hydrogen is still in its infancy, but many organizations are investing in the construction of new green hydrogen production plants to aid in the reduction of GHG emissions. These factors are expected to boost the hydrogen generation market growth through the forecast period.
High Cost of Initial Investment and Technology Constraints:
The manufacturing of hydrogen requires a significant amount of capital investment. Various technologies, such as electrolysis, are quite expensive and use a lot of energy to produce hydrogen. These aspects are expected to hamper the hydrogen generation market growth during the forecast period. In addition, some of the key difficulties related to the use of hydrogen generation are the expense of production, safety concerns, delayed infrastructure development, and existing rules that limit hydrogen usage.
Hydrogen Generation Market Segment Analysis:
By Source, the Hydrogen Generation Market is segmented into Blue Hydrogen, Green Hydrogen, and Grey Hydrogen. The Blue Hydrogen segment dominated the market with 53.8% in 2023. Steam methane reforming is used to produce blue hydrogen from natural gas. It combines natural gas with extremely hot steam in the presence of a catalyst, resulting in hydrogen and carbon monoxide as a result of a chemical reaction. When extra water is added to the mixture, the carbon monoxide is converted to carbon dioxide and as a result, more hydrogen is produced. Carbon dioxide emissions are absorbed and stored underground using carbon capture, utilization, and storage technology, leaving practically pure hydrogen in the process. In addition, the cost of producing blue hydrogen is inexpensive when compared to other types.
By Delivery Mode, the Hydrogen Generation Market is segmented into Captive and Merchant. The Merchant segment dominated the market with 61.3% in 2023. The term merchant generation refers to hydrogen that is produced at a central location and then transported and sold to customers via bulk tank, cylinder truck, or pipeline. There is a substantial existing natural gas pipeline network in many nations, including the United States, Canada, and Russia, that might be utilized to transport and distribute hydrogen. New infrastructure is being built in the Asia Pacific region's growing economies, with dedicated pipeline and shipping networks possibly allowing large-scale foreign hydrogen transit.
The captive segment is expected to grow at the fastest CAGR of 8.7% during the forecast period. Given its simplicity of adoption, this technology has a large-scale penetration in socioeconomically developing regions, particularly North America and Europe. The captive hydrogen generation market, which is defined as on-site generation that eliminates various challenges associated with hydrogen conveyance and distribution, is expected to increase significantly. On-site hydrogen generation has gained popularity in small-scale companies due to new technologies being given at reasonable rates as compared to delivered distribution channels.
Hydrogen Generation Market Regional Insights:
The Asia Pacific region dominated the hydrogen generation market with a 36% share in 2023. Asia Pacific is a prominent market for green technology adoption in order to satisfy government targets for lowering GHG emissions. Thanks to the commercial deployment of Japanese fuel cell micro-CHP devices, Japan and South Korea have been significantly investing in fuel cell adoption since 2009. Japan was the first country to commercialize fuel cells, and it is currently funding studies including their usage in household and automobile applications. Its goal is to mass-produce green hydrogen. To meet global carbon emission limits, the country wants to have 20000 green hydrogen fuel cell vehicles and 320 hydrogen recharging stations by 2025.
APAC hydrogen generation market growth is expected to be boosted by strong economic performance and large-scale R&D investments in Asia Pacific developing countries including China, Japan, South Korea, India, and Australia. China is making significant reforms to its gasoline and petroleum industries in order to address a variety of issues, including pollution and economic disparities between urban and rural populations. Pollution in the air and rising sulfur levels in the environment are also posing problems for the country.
The objective of the report is to present a comprehensive analysis of the Global Hydrogen Generation Market to the stakeholders in the industry. The report provides trends that are most dominant in the Global Hydrogen Generation Market and how these trends will influence new business investments and market development throughout the forecast period. The report also aids in the comprehension of the global market dynamics and competitive structure of the market by analyzing market leaders, market followers, and regional players.
The qualitative and quantitative data provided in the Global Hydrogen Generation Market report is to help understand which market segments, regions are expected to grow at higher rates, factors affecting the market, and key opportunity areas, which will drive the industry and market growth through the forecast period. The report also includes the competitive landscape of key players in the industry along with their recent developments in the Global Hydrogen Generation Market. The report studies factors such as company size, market share, market growth, revenue, production volume, and profits of the key players in the global market.
The report provides Porter's Five Force Model, which helps in designing the business strategies in the market. The report helps in identifying how many rivals are existing, who they are, and how their product quality is in the Global Hydrogen Generation Market. The report also analyses if the Global Hydrogen Generation Market is easy for a new player to gain a foothold in the market, do they enter or exit the market regularly if the market is dominated by a few players, etc.
The report also includes a PESTEL Analysis, which aids in the development of company strategies. Political variables help in figuring out how much a government can influence the Global Hydrogen Generation Market. Economic variables aid in the analysis of economic performance drivers that have an impact on the Global Hydrogen Generation Market. Understanding the impact of the surrounding environment and the influence of environmental concerns on the global market is aided by legal factors.
Hydrogen Generation Market Scope:
|
Hydrogen Generation Market |
|
|
Market Size in 2023 |
USD 173.05 Bn. |
|
Market Size in 2030 |
USD 314.53 Bn. |
|
CAGR (2024-2030) |
8.91% |
|
Historic Data |
2018-2022 |
|
Base Year |
2023 |
|
Forecast Period |
2024-2030 |
|
Segment Scope |
By Sources
|
|
By Technology
|
|
|
By Delivery Mode
|
|
|
By Application
|
|
|
Regional Scope |
North America- United States, Canada, and Mexico Europe – UK, France, Germany, Italy, Spain, Sweden, Austria, and Rest of Europe Asia Pacific – China, India, Japan, South Korea, Australia, ASEAN, Rest of APAC Middle East and Africa - South Africa, GCC, Egypt, Nigeria, Rest of the Middle East and Africa South America – Brazil, Argentina, Rest of South America |
Hydrogen Generation Market Key Players:
- Air Liquide (France)
- Messer Group (Germany)
- Nuvera Fuel Cells (US)
- Xebec (Canada)
- Ballard Power Systems (Canada)
- Plug Power (US)
- Air Products and Chemicals (US)
- Teledyne Energy Systems (US)
- Showa Denko (Japan)
- Nippon Sanso (Japan)
- Hydrogenics (Canada)
- Ally Hi-Tech (China)
- Cummins (US)
- Linde (Germany)
- Iwatani (Japan)
- Engie (France)
- ITM Power (UK)
- NEL Hydrogen (Norway)
- Fuel Cell Energy (US)
- Taiyo Nippon (Japan)
- Xebec (Canada)
- Uniper (Germany)
- McPhy Energy (France)
- Enapter (Germany)
- Starfire Energy (US)
- Claind (Italy)
- Plug Power (US)
Frequently Asked Questions
The Asia Pacific region is expected to hold the highest share in the Hydrogen Generation Market.
The market size of the Hydrogen Generation Market by 2030 is expected to reach at US$ 314.53 Bn.
The forecast period for the Hydrogen Generation Market is 2024-2030
The market size of the Hydrogen Generation Market in 2023 was valued at US$ 173.05 Bn.
Chapter 1 Scope of the Report
Chapter 2 Research Methodology
2.1.Research Process
2.2.Global Hydrogen Generation Market: Target Audience
2.3.Global Hydrogen Generation Market: Primary Research (As per Client Requirement)
2.4.Global Hydrogen Generation Market: Secondary Research
Chapter 3 Executive Summary
Chapter 4 Competitive Landscape
4.1.Market Share Analysis, By Value,2023-2030
4.1.1.Market Share Analysis, By Region, By Value,2023-2030 (In %)
4.1.1.1.North America Market Share Analysis, By Value,2023-2030 (In %)
4.1.1.2.Europe Market Share Analysis, By Value,2023-2030 (In %)
4.1.1.3.Asia Pacific Market Share Analysis, By Value,2023-2030 (In %)
4.1.1.4.South America Market Share Analysis, By Value,2023-2030 (In %)
4.1.1.5.Middle East and Africa Market Share Analysis, By Value,2023-2030 (In %)
4.1.2.Market Share Analysis, By Source, By Value,2023-2030 (In %)
4.1.2.1. North America Market Share Analysis, By Source, By Value,2023-2030 (In %)
4.1.2.1.1.USA Market Share Analysis, By Source, By Value,2023-2030 (In %)
4.1.2.1.2.Canada Market Share Analysis, By Source, By Value,2023-2030 (In %)
4.1.2.1.3.Mexico Market Share Analysis, By Source, By Value,2023-2030 (In %)
4.1.2.2. Europe Market Share Analysis, By Source, By Value,2023-2030 (In %)
4.1.2.2.1.UK Market Share Analysis, By Source, By Value,2023-2030 (In %)
4.1.2.2.2.France Market Share Analysis, By Source, By Value,2023-2030 (In %)
4.1.2.2.3.Germany Market Share Analysis, By Source, By Value,2023-2030 (In %)
4.1.2.2.4.Italy Market Share Analysis, By Source, By Value,2023-2030 (In %)
4.1.2.2.5.Spain Market Share Analysis, By Source, By Value,2023-2030 (In %)
4.1.2.2.6.Sweden Market Share Analysis, By Source, By Value,2023-2030 (In %)
4.1.2.2.7.Austria Market Share Analysis, By Source, By Value,2023-2030 (In %)
4.1.2.2.8.Rest of Europe Market Share Analysis, By Source, By Value,2023-2030 (In %)
4.1.2.3. Asia Pacific Market Share Analysis, By Source, By Value,2023-2030 (In %)
4.1.2.3.1.China Market Share Analysis, By Source, By Value,2023-2030 (In %)
4.1.2.3.2.India Market Share Analysis, By Source, By Value,2023-2030 (In %)
4.1.2.3.3.Japan Market Share Analysis, By Source, By Value,2023-2030 (In %)
4.1.2.3.4.South Korea Market Share Analysis, By Source, By Value,2023-2030 (In %)
4.1.2.3.5.Australia Market Share Analysis, By Source, By Value,2023-2030 (In %)
4.1.2.3.6.ASEAN Market Share Analysis, By Source, By Value,2023-2030 (In %)
4.1.2.3.7.Rest of APAC Market Share Analysis, By Source, By Value,2023-2030 (In %)
4.1.2.4. South America Market Share Analysis, By Source, By Value,2023-2030 (In %)
4.1.2.4.1.Brazil Market Share Analysis, By Source, By Value,2023-2030 (In %)
4.1.2.4.2.Argentina Market Share Analysis, By Source, By Value,2023-2030 (In %)
4.1.2.4.3.Rest of South America Market Share Analysis, By Source, By Value,2023-2030 (In %)
4.1.2.5. Middle East and Africa Market Share Analysis, By Source, By Value,2023-2030 (In %)
4.1.2.5.1.South Africa Market Share Analysis, By Source, By Value,2023-2030 (In %)
4.1.2.5.2.GCC Market Share Analysis, By Source, By Value,2023-2030 (In %)
4.1.2.5.3.Egypt Market Share Analysis, By Source, By Value,2023-2030 (In %)
4.1.2.5.4.Nigeria Market Share Analysis, By Source, By Value,2023-2030 (In %)
4.1.2.5.5.Rest of Middle East and Africa Market Share Analysis, By Source, By Value,2023-2030 (In %)
4.1.3.Market Share Analysis, By Technology, By Value,2023-2030 (In %)
4.1.3.1. North America Market Share Analysis, By Technology, By Value,2023-2030 (In %)
4.1.3.1.1.USA Market Share Analysis, By Technology, By Value,2023-2030 (In %)
4.1.3.1.2.Canada Market Share Analysis, By Technology, By Value,2023-2030 (In %)
4.1.3.1.3.Mexico Market Share Analysis, By Technology, By Value,2023-2030 (In %)
4.1.3.2. Europe Market Share Analysis, By Technology, By Value,2023-2030 (In %)
4.1.3.2.1.UK Market Share Analysis, By Technology, By Value,2023-2030 (In %)
4.1.3.2.2.France Market Share Analysis, By Technology, By Value,2023-2030 (In %)
4.1.3.2.3.Germany Market Share Analysis, By Technology, By Value,2023-2030 (In %)
4.1.3.2.4.Italy Market Share Analysis, By Technology, By Value,2023-2030 (In %)
4.1.3.2.5.Spain Market Share Analysis, By Technology, By Value,2023-2030 (In %)
4.1.3.2.6.Sweden Market Share Analysis, By Technology, By Value,2023-2030 (In %)
4.1.3.2.7.Austria Market Share Analysis, By Technology, By Value,2023-2030 (In %)
4.1.3.2.8.Rest of Europe Market Share Analysis, By Technology, By Value,2023-2030 (In %)
4.1.3.3. Asia Pacific Market Share Analysis, By Technology, By Value,2023-2030 (In %)
4.1.3.3.1.China Market Share Analysis, By Technology, By Value,2023-2030 (In %)
4.1.3.3.2.India Market Share Analysis, By Technology, By Value,2023-2030 (In %)
4.1.3.3.3.Japan Market Share Analysis, By Technology, By Value,2023-2030 (In %)
4.1.3.3.4.South Korea Market Share Analysis, By Technology, By Value,2023-2030 (In %)
4.1.3.3.5.Australia Market Share Analysis, By Technology, By Value,2023-2030 (In %)
4.1.3.3.6.ASEAN Market Share Analysis, By Technology, By Value,2023-2030 (In %)
4.1.3.3.7.Rest of APAC Market Share Analysis, By Technology, By Value,2023-2030 (In %)
4.1.3.4. South America Market Share Analysis, By Technology, By Value,2023-2030 (In %)
4.1.3.4.1.Brazil Market Share Analysis, By Technology, By Value,2023-2030 (In %)
4.1.3.4.2.Argentina Market Share Analysis, By Technology, By Value,2023-2030 (In %)
4.1.3.4.3.Rest of South America Market Share Analysis, By Technology, By Value,2023-2030 (In %)
4.1.3.5. Middle East and Africa Market Share Analysis, By Technology, By Value,2023-2030 (In %)
4.1.3.5.1.South Africa Market Share Analysis, By Technology, By Value,2023-2030 (In %)
4.1.3.5.2.GCC Market Share Analysis, By Technology, By Value,2023-2030 (In %)
4.1.3.5.3.Egypt Market Share Analysis, By Technology, By Value,2023-2030 (In %)
4.1.3.5.4.Nigeria Market Share Analysis, By Technology, By Value,2023-2030 (In %)
4.1.3.5.5.Rest of Middle East and Africa Market Share Analysis, By Technology, By Value,2023-2030 (In %)
4.1.4.Market Share Analysis, By Delivery Mode, By Value,2023-2030 (In %)
4.1.4.1.North America Market Share Analysis, By Delivery Mode, By Value,2023-2030 (In %)
4.1.4.1.1.USA Market Share Analysis, By Delivery Mode, By Value,2023-2030 (In %)
4.1.4.1.2.Canada Market Share Analysis, By Delivery Mode, By Value,2023-2030 (In %)
4.1.4.1.3.Mexico Market Share Analysis, By Delivery Mode, By Value,2023-2030 (In %)
4.1.4.2. Europe Market Share Analysis, By Delivery Mode, By Value,2023-2030 (In %)
4.1.4.2.1.UK Market Share Analysis, By Delivery Mode, By Value,2023-2030 (In %)
4.1.4.2.2.France Market Share Analysis, By Delivery Mode, By Value,2023-2030 (In %)
4.1.4.2.3.Germany Market Share Analysis, By Delivery Mode, By Value,2023-2030 (In %)
4.1.4.2.4.Italy Market Share Analysis, By Delivery Mode, By Value,2023-2030 (In %)
4.1.4.2.5.Spain Market Share Analysis, By Delivery Mode, By Value,2023-2030 (In %)
4.1.4.2.6.Sweden Market Share Analysis, By Delivery Mode, By Value,2023-2030 (In %)
4.1.4.2.7.Austria Market Share Analysis, By Delivery Mode, By Value,2023-2030 (In %)
4.1.4.2.8.Rest of Europe Market Share Analysis, By Delivery Mode, By Value,2023-2030 (In %)
4.1.4.3. Asia Pacific Market Share Analysis, By Delivery Mode, By Value,2023-2030 (In %)
4.1.4.3.1.China Market Share Analysis, By Delivery Mode, By Value,2023-2030 (In %)
4.1.4.3.2.India Market Share Analysis, By Delivery Mode, By Value,2023-2030 (In %)
4.1.4.3.3.Japan Market Share Analysis, By Delivery Mode, By Value,2023-2030 (In %)
4.1.4.3.4.South Korea Market Share Analysis, By Delivery Mode, By Value,2023-2030 (In %)
4.1.4.3.5.Australia Market Share Analysis, By Delivery Mode, By Value,2023-2030 (In %)
4.1.4.3.6.ASEAN Market Share Analysis, By Delivery Mode, By Value,2023-2030 (In %)
4.1.4.3.7.Rest of APAC Market Share Analysis, By Delivery Mode, By Value,2023-2030 (In %)
4.1.4.4. South America Market Share Analysis, By Delivery Mode, By Value,2023-2030 (In %)
4.1.4.4.1.Brazil Market Share Analysis, By Delivery Mode, By Value,2023-2030 (In %)
4.1.4.4.2.Argentina Market Share Analysis, By Delivery Mode, By Value,2023-2030 (In %)
4.1.4.4.3.Rest of South America Market Share Analysis, By Delivery Mode, By Value,2023-2030 (In %)
4.1.4.5. Middle East and Africa Market Share Analysis, By Delivery Mode, By Value,2023-2030 (In %)
4.1.4.5.1.South Africa Market Share Analysis, By Delivery Mode, By Value,2023-2030 (In %)
4.1.4.5.2.GCC Market Share Analysis, By Delivery Mode, By Value,2023-2030 (In %)
4.1.4.5.3.Egypt Market Share Analysis, By Delivery Mode, By Value,2023-2030 (In %)
4.1.4.5.4.Nigeria Market Share Analysis, By Delivery Mode, By Value,2023-2030 (In %)
4.1.4.5.5.Rest of Middle East and Africa Market Share Analysis, By Delivery Mode, By Value,2023-2030 (In %)
4.1.5.Market Share Analysis, By Application, By Value,2023-2030 (In %)
4.1.5.1. North America Market Share Analysis, By Application, By Value,2023-2030 (In %)
4.1.5.1.1.USA Market Share Analysis, By Application, By Value,2023-2030 (In %)
4.1.5.1.2.Canada Market Share Analysis, By Application, By Value,2023-2030 (In %)
4.1.5.1.3.Mexico Market Share Analysis, By Application, By Value,2023-2030 (In %)
4.1.5.2. Europe Market Share Analysis, By Application, By Value,2023-2030 (In %)
4.1.5.2.1.UK Market Share Analysis, By Application, By Value,2023-2030 (In %)
4.1.5.2.2.France Market Share Analysis, By Application, By Value,2023-2030 (In %)
4.1.5.2.3.Germany Market Share Analysis, By Application, By Value,2023-2030 (In %)
4.1.5.2.4.Italy Market Share Analysis, By Application, By Value,2023-2030 (In %)
4.1.5.2.5.Spain Market Share Analysis, By Application, By Value,2023-2030 (In %)
4.1.5.2.6.Sweden Market Share Analysis, By Application, By Value,2023-2030 (In %)
4.1.5.2.7.Austria Market Share Analysis, By Application, By Value,2023-2030 (In %)
4.1.5.2.8.Rest of Europe Market Share Analysis, By Application, By Value,2023-2030 (In %)
4.1.5.3. Asia Pacific Market Share Analysis, By Application, By Value,2023-2030 (In %)
4.1.5.3.1.China Market Share Analysis, By Application, By Value,2023-2030 (In %)
4.1.5.3.2.India Market Share Analysis, By Application, By Value,2023-2030 (In %)
4.1.5.3.3.Japan Market Share Analysis, By Application, By Value,2023-2030 (In %)
4.1.5.3.4.South Korea Market Share Analysis, By Application, By Value,2023-2030 (In %)
4.1.5.3.5.Australia Market Share Analysis, By Application, By Value,2023-2030 (In %)
4.1.5.3.6.ASEAN Market Share Analysis, By Application, By Value,2023-2030 (In %)
4.1.5.3.7.Rest of APAC Market Share Analysis, By Application, By Value,2023-2030 (In %)
4.1.5.4. South America Market Share Analysis, By Application, By Value,2023-2030 (In %)
4.1.5.4.1.Brazil Market Share Analysis, By Application, By Value,2023-2030 (In %)
4.1.5.4.2.Argentina Market Share Analysis, By Application, By Value,2023-2030 (In %)
4.1.5.4.3.Rest of South America Market Share Analysis, By Application, By Value,2023-2030 (In %)
4.1.5.5. Middle East and Africa Market Share Analysis, By Application, By Value,2023-2030 (In %)
4.1.5.5.1.South Africa Market Share Analysis, By Application, By Value,2023-2030 (In %)
4.1.5.5.2.GCC Market Share Analysis, By Application, By Value,2023-2030 (In %)
4.1.5.5.3.Egypt Market Share Analysis, By Application, By Value,2023-2030 (In %)
4.1.5.5.4.Nigeria Market Share Analysis, By Application, By Value,2023-2030 (In %)
4.1.5.6. Rest of Middle East and Africa Market Share Analysis, By Application, By Value,2023-2030 (In %)
4.2. Stellar Competition matrix
4.2.1.Global Stellar Competition Matrix
4.2.2.North America Stellar Competition Matrix
4.2.3.Europe Stellar Competition Matrix
4.2.4.Asia Pacific Stellar Competition Matrix
4.2.5.South America Stellar Competition Matrix
4.2.6.Middle East and Africa Stellar Competition Matrix
4.3. Key Players Benchmarking
4.3.1.Key Players Benchmarking By Source, Pricing, Market Share, Investments, Expansion Plans, Physical Presence and Presence in the Market.
4.4. Mergers and Acquisitions in Industry
4.4.1.M&A by Region, Value and Strategic Intent
4.5. Market Dynamics
4.5.1.Market Drivers
4.5.2.Market Restraints
4.5.3.Market Opportunities
4.5.4.Market Challenges
4.5.5.PESTLE Analysis
4.5.6.PORTERS Five Force Analysis
4.5.7.Value Chain Analysis
Chapter 5 Global Hydrogen Generation Market Segmentation: By Source
5.1.Global Hydrogen Generation Market, By Source, Overview/Analysis,2023-2030
5.2.Global Hydrogen Generation Market, By Source, By Value, Market Share (%),2023-2030 (USD Million)
5.3.Global Hydrogen Generation Market, By Source, By Value, -
5.3.1.Blue Hydrogen
5.3.2.Green Hydrogen
5.3.3.Grey Hydrogen
Chapter 6 Global Hydrogen Generation Market Segmentation: By Technology
6.1.Global Hydrogen Generation Market, By Technology, Overview/Analysis,2023-2030
6.2.Global Hydrogen Generation Market Size, By Technology, By Value, Market Share (%),2023-2030 (USD Million)
6.3.Global Hydrogen Generation Market, By Technology, By Value, -
6.3.1.Steam Methane Reforming (SMR)
6.3.2.Partial Oxidation (POX)
6.3.3.Coal Gasification
6.3.4.Electrolysis
Chapter 7 Global Hydrogen Generation Market Segmentation: By Delivery Mode
7.1.Global Hydrogen Generation Market, By Delivery Mode, Overview/Analysis,2023-2030
7.2.Global Hydrogen Generation Market Size, By Delivery Mode, By Value, Market Share (%),2023-2030 (USD Million)
7.3.Global Hydrogen Generation Market, By Delivery Mode, By Value, -
7.3.1.Captive
7.3.2.Merchant
Chapter 8 Global Hydrogen Generation Market Segmentation: By Application
8.1.Global Hydrogen Generation Market, By Application, Overview/Analysis,2023-2030
8.2.Global Hydrogen Generation Market Size, By Application, By Value, Market Share (%),2023-2030 (USD Million)
8.3.Global Hydrogen Generation Market, By Application, By Value, -
8.3.1.Petroleum Refinery
8.3.2.Ammonia Production
8.3.3.Methanol Production
8.3.4.Transportation
8.3.5.Power Generation
8.3.6.Others
Chapter 9 Global Hydrogen Generation Market Segmentation: By Region
9.1. Global Hydrogen Generation Market, By Region – North America
9.1.1.North America Hydrogen Generation Market Size, By Source, By Value,2023-2030 (USD Million)
9.1.2.North America Hydrogen Generation Market Size, By Technology, By Value,2023-2030 (USD Million)
9.1.3.North America Hydrogen Generation Market Size, By Delivery Mode, By Value,2023-2030 (USD Million)
9.1.4.North America Hydrogen Generation Market Size, By Application, By Value,2023-2030 (USD Million)
9.1.5.By Country – U.S.
9.1.5.1.U.S.Hydrogen Generation Market Size, By Source, By Value, 2023-2030 (USD Million)
9.1.5.2.U.S.Hydrogen Generation Market Size, By Technology, By Value,2023-2030 (USD Million)
9.1.5.3.U.S.Hydrogen Generation Market Size, By Delivery Mode, By Value,2023-2030 (USD Million)
9.1.5.4.U.S.Hydrogen Generation Market Size, By Application, By Value,2023-2030 (USD Million)
9.1.5.5.Canada Hydrogen Generation Market Size, By Value,2023-2030 (USD Million)
9.1.5.6.Mexico Hydrogen Generation Market Size, By Value,2023-2030 (USD Million)
9.2.Europe Hydrogen Generation Market Size, By Value,2023-2030 (USD Million)
9.2.1.UK
9.2.2.France
9.2.3.Germany
9.2.4.Italy
9.2.5.Spain
9.2.6.Sweden
9.2.7.Austria
9.2.8.Rest of Europe
9.3. Asia Pacific Hydrogen Generation Market Size, By Value,2023-2030 (USD Million)
9.3.1.China
9.3.2.India
9.3.3.Japan
9.3.4.South Korea
9.3.5.Australia
9.3.6.ASEAN
9.3.7.Rest of APAC
9.4. Middle East and Africa Hydrogen Generation Market Size, By Value,2023-2030 (USD Million)
9.4.1.South Africa
9.4.2.GCC
9.4.3.Egypt
9.4.4.Nigeria
9.4.5.Rest of Middle East and Africa
9.5. South America Hydrogen Generation Market Size, By Value,2023-2030 (USD Million)
9.5.1.Brazil
9.5.2.Argentina
9.5.3.Rest of South America
Chapter 10 Company Profiles
10.1.Key Players
10.1.1.Air Liquide (France)
10.1.1.1.Company Overview
10.1.1.2.Tube Portfolio
10.1.1.3.Financial Overview
10.1.1.4.Business Strategy
10.1.1.5.Key Developments
10.1.2.Messer Group (Germany)
10.1.3.Nuvera Fuel Cells (US)
10.1.4.Xebec (Canada)
10.1.5.Ballard Power Systems (Canada)
10.1.6.Plug Power (US)
10.1.7.Air Products and Chemicals (US)
10.1.8.Teledyne Energy Systems (US)
10.1.9.Showa Denko (Japan)
10.1.10.Nippon Sanso (Japan)
10.1.11.Hydrogenics (Canada)
10.1.12.Ally Hi-Tech (China)
10.1.13.Cummins (US)
10.1.14.Linde (Germany)
10.1.15.Iwatani (Japan)
10.1.16.Engie (France)
10.1.17.ITM Power (UK)
10.1.18.NEL Hydrogen (Norway)
10.1.19.Fuel Cell Energy (US)
10.1.20.Taiyo Nippon (Japan)
10.1.21.Xebec (Canada)
10.1.22.Uniper (Germany)
10.1.23.McPhy Energy (France)
10.1.24.Enapter (Germany)
10.1.25.Starfire Energy (US)
10.1.26.Claind (Italy)
10.1.27.Plug Power (US)
10.2.Key Findings
10.3.Recommendations


